The Communication and Information Network Association of Japan (CIAJ) announces the telecommunication equipment and trade figures for the Third Quarter (October-December) of FY2021 as follows.
I. Summary
In October through December 2021 (third quarter), both private consumption and capital expenditure in the Japanese economy improved, and the annualized rate of real GDP growth for the Oct-Dec quarter was positive 4.6% (second preliminary figure: March 9). This was the first time it was positive in two quarters. This partly reflects the easing of restrictions on economic activity following the government ending the state of emergency that was declared due to the COVID-19 pandemic.
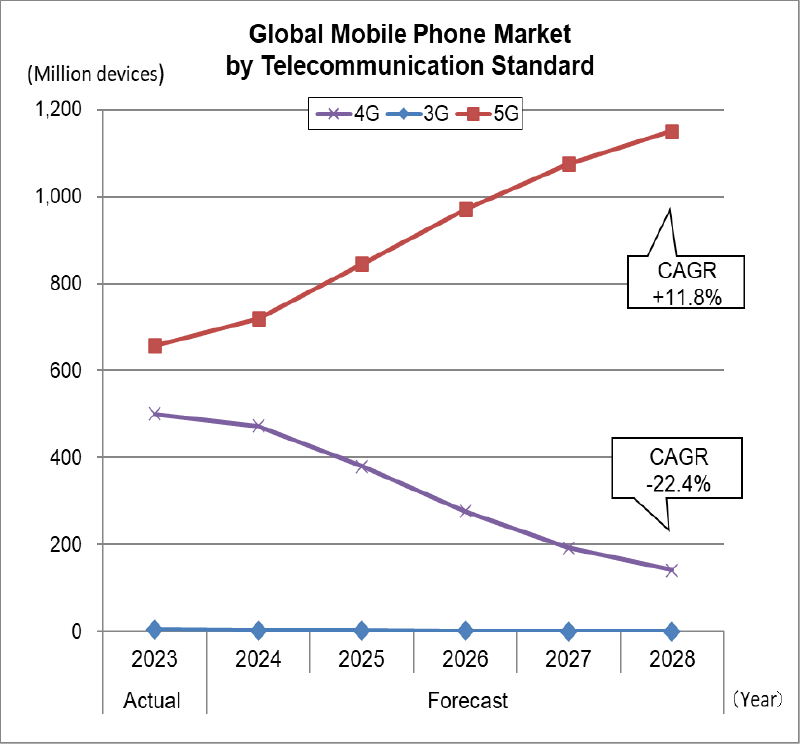
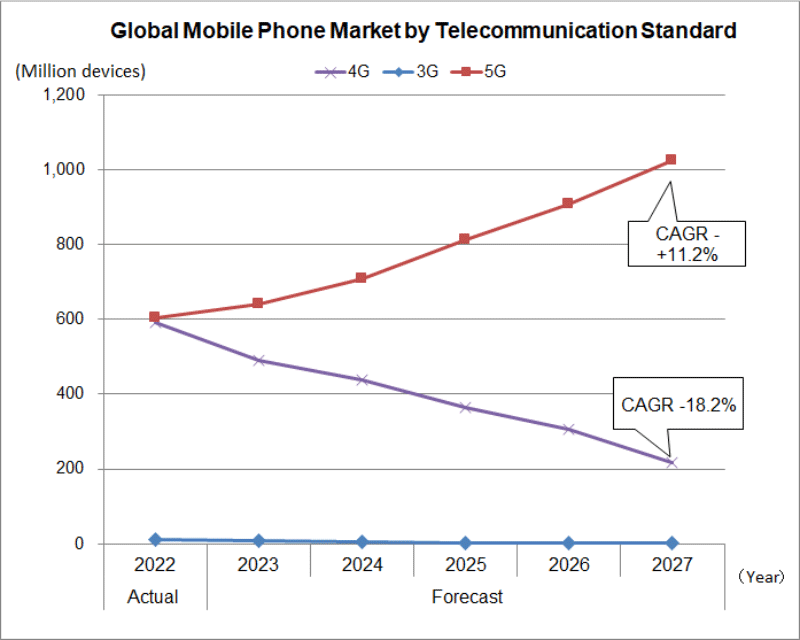
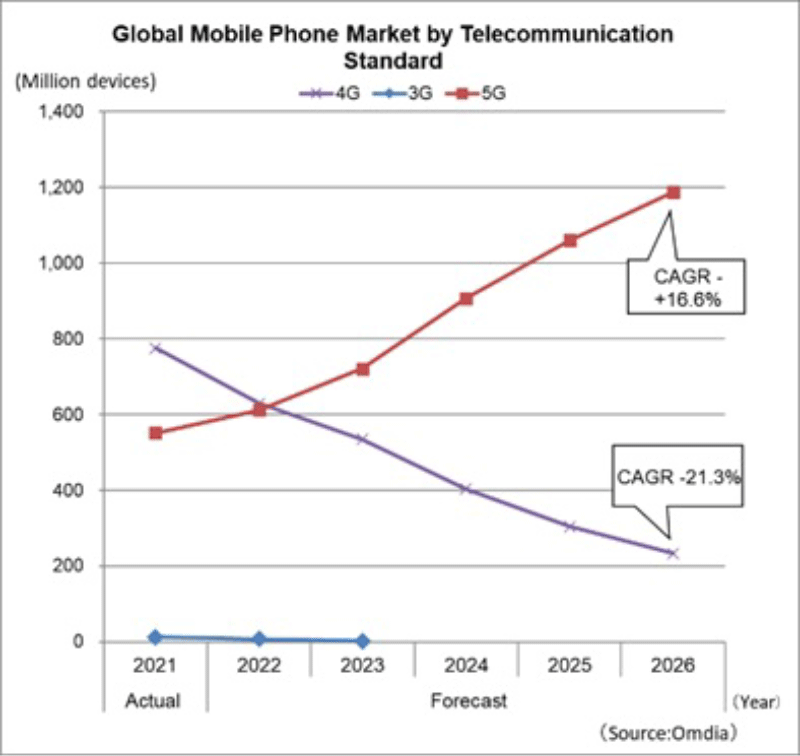
In these circumstances, the telecom market saw demand for 5G-compatible smartphones and communication infrastructure begin to recover but declined year on year due to a fall in demand for certain models in reaction to the growth in the previous year and a fall in production of some models reflecting restrictions in parts supply.
(1) Domestic Market Trends
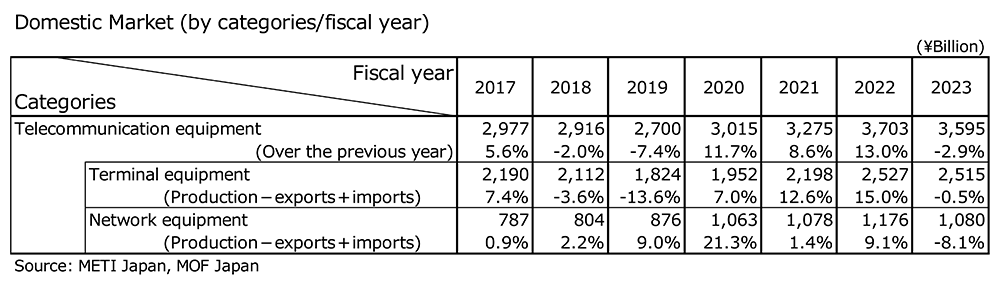
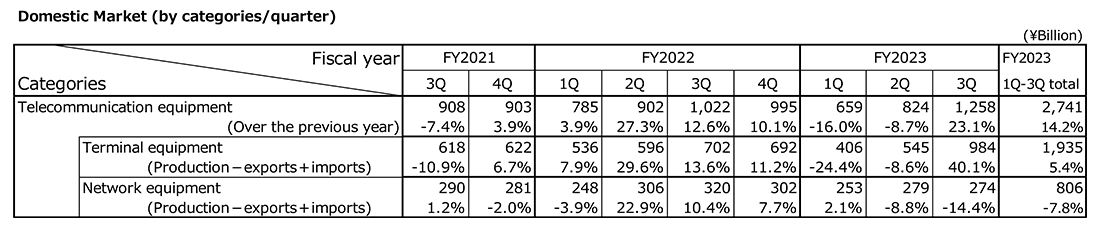
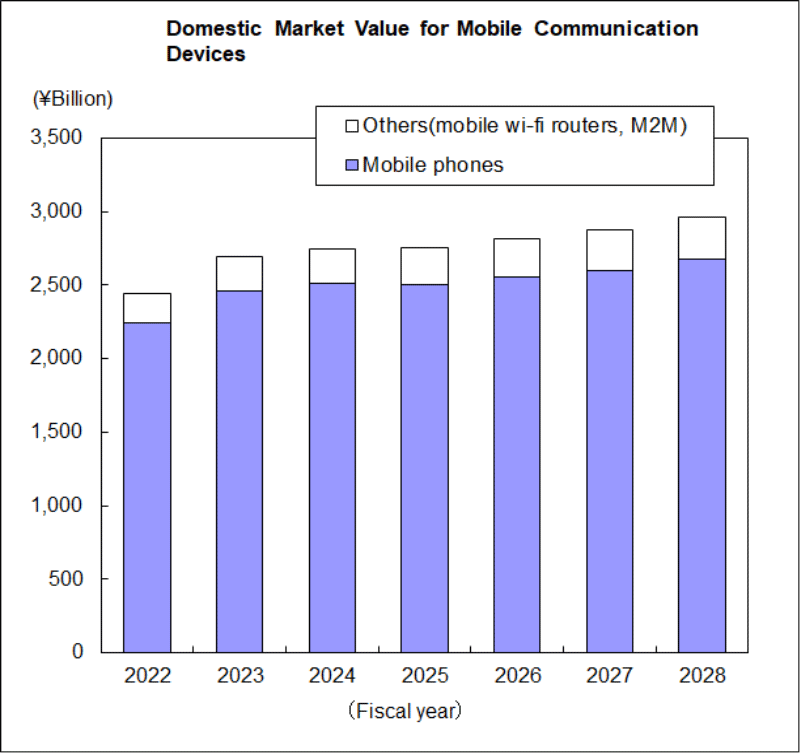
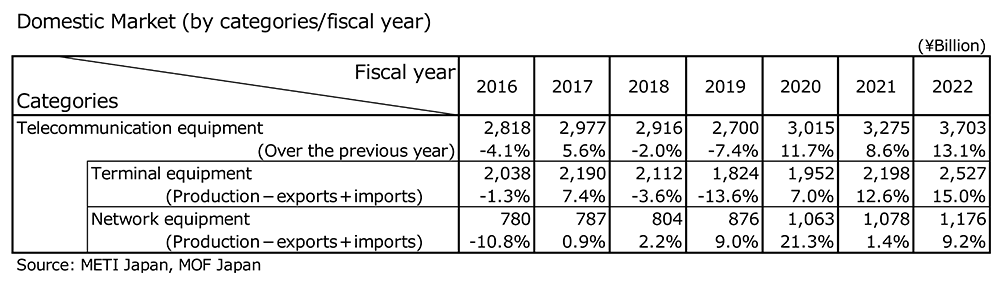
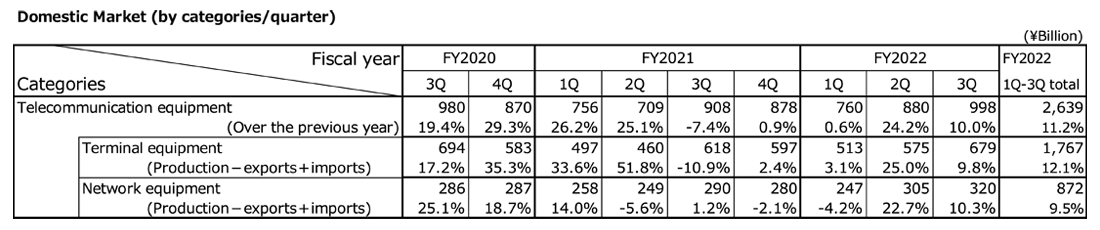
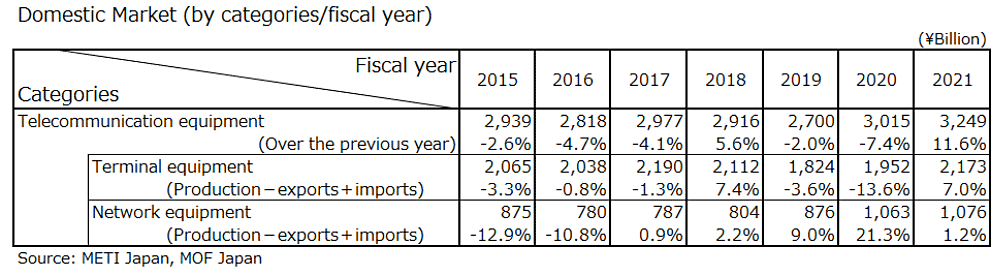
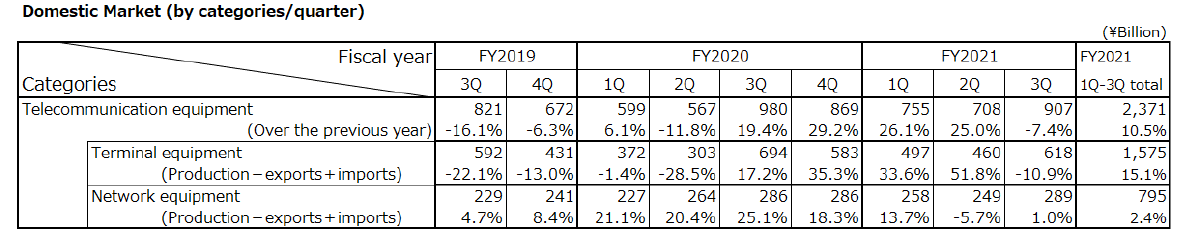
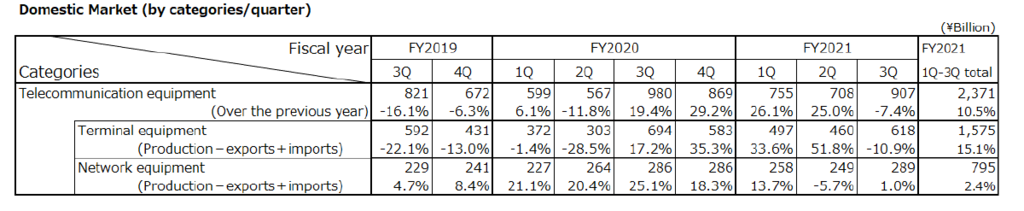
The domestic market value (domestic production value – export value + import value, excluding components) amounted to 907.3 billion yen in the October through December period, a year-on-year decrease of 7.4%. The decrease resulted from reduction in production and a decrease in import of mobile phones.
(2) Domestic Production Trends
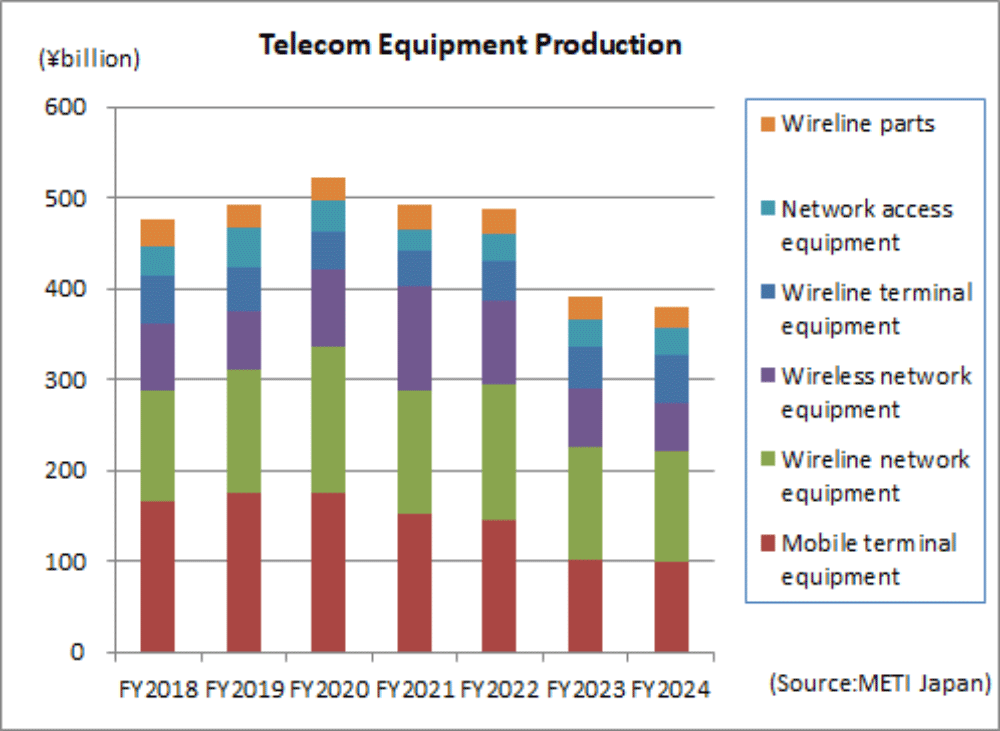
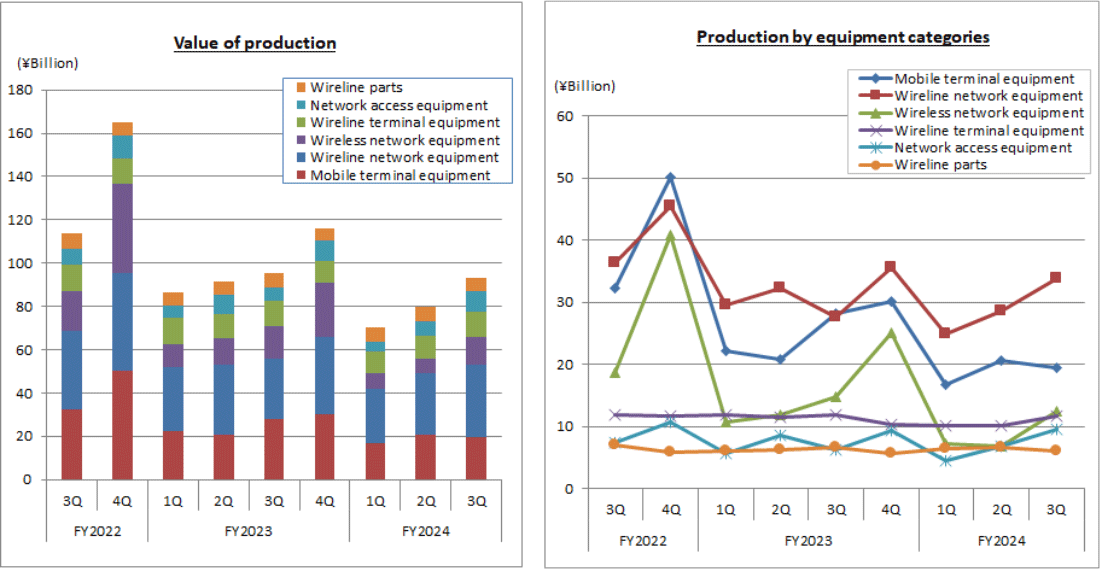
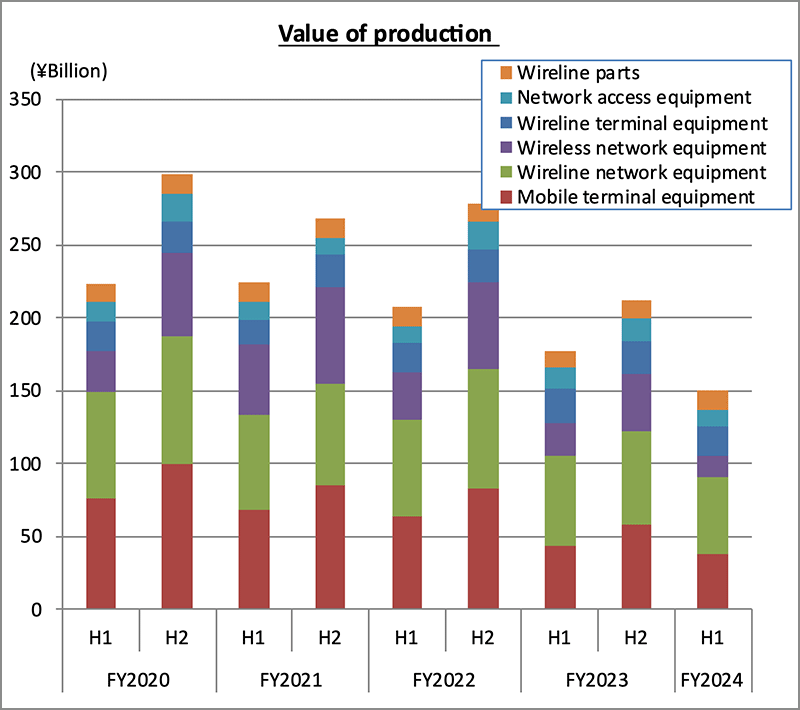
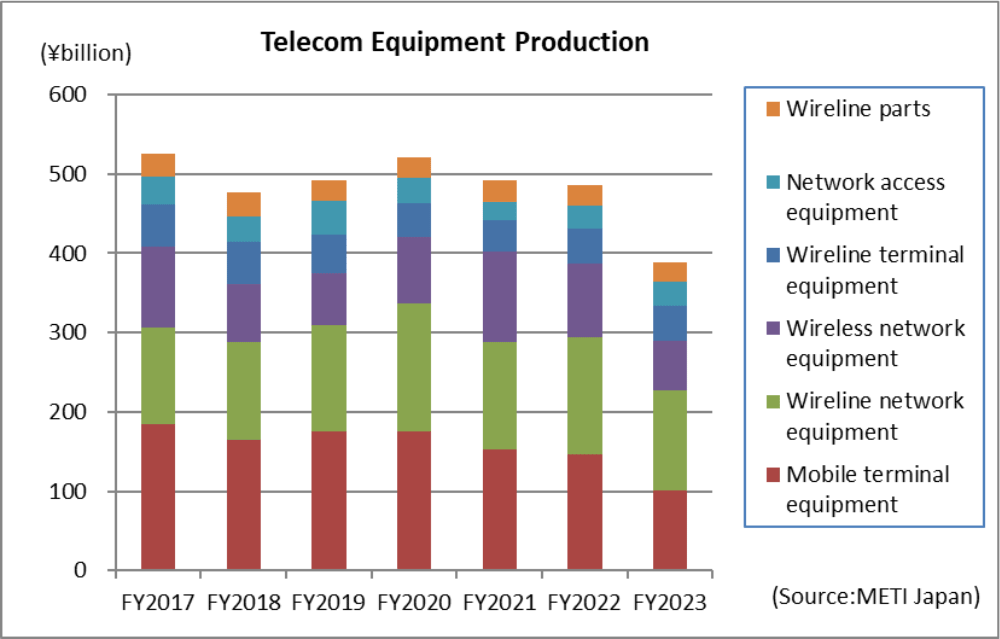
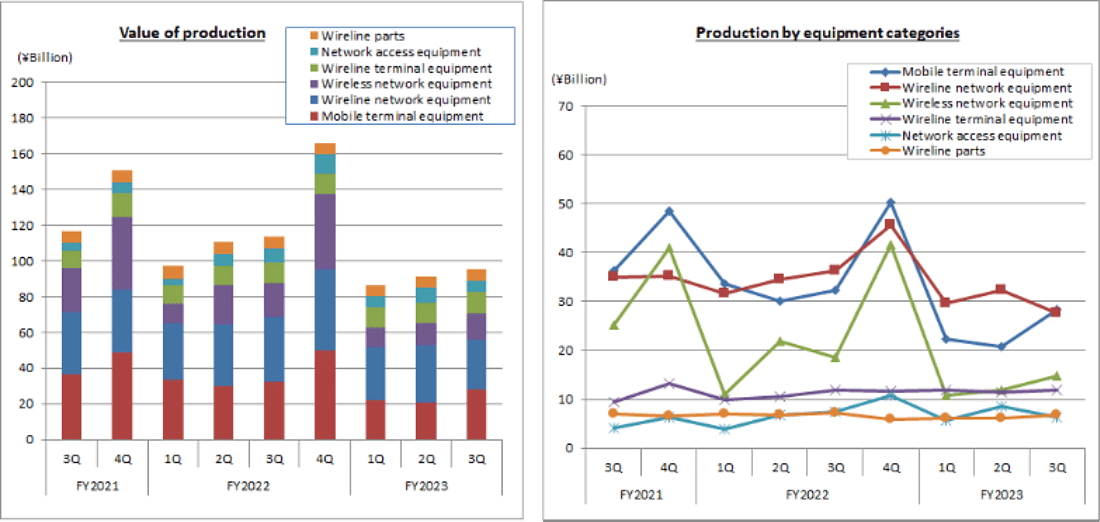
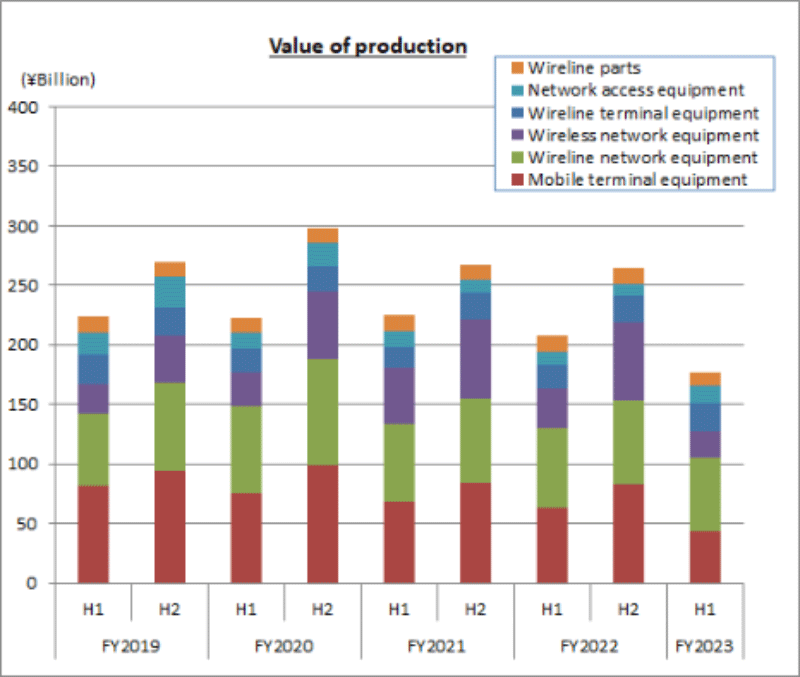
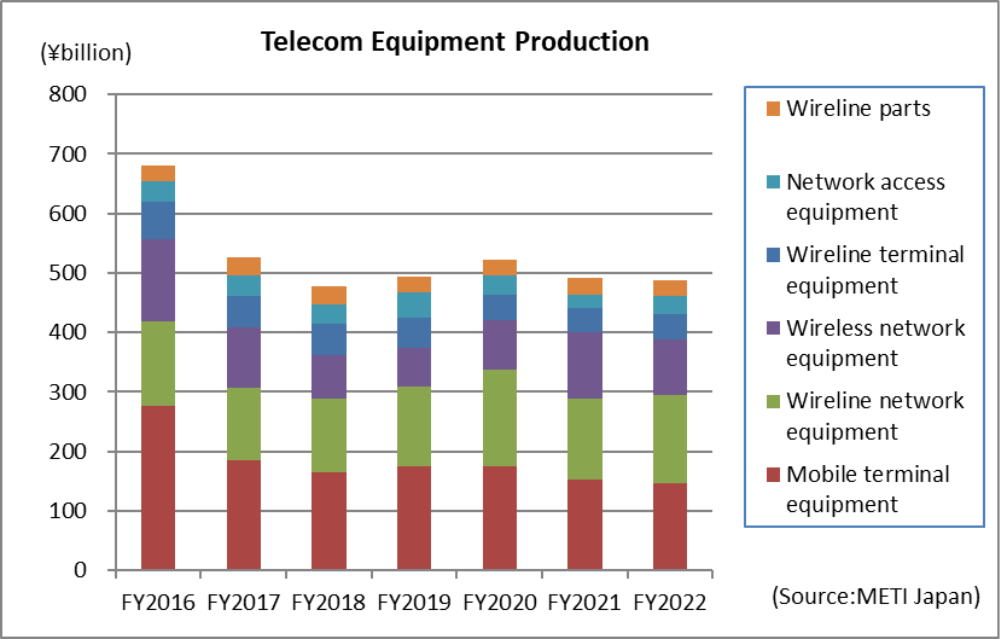
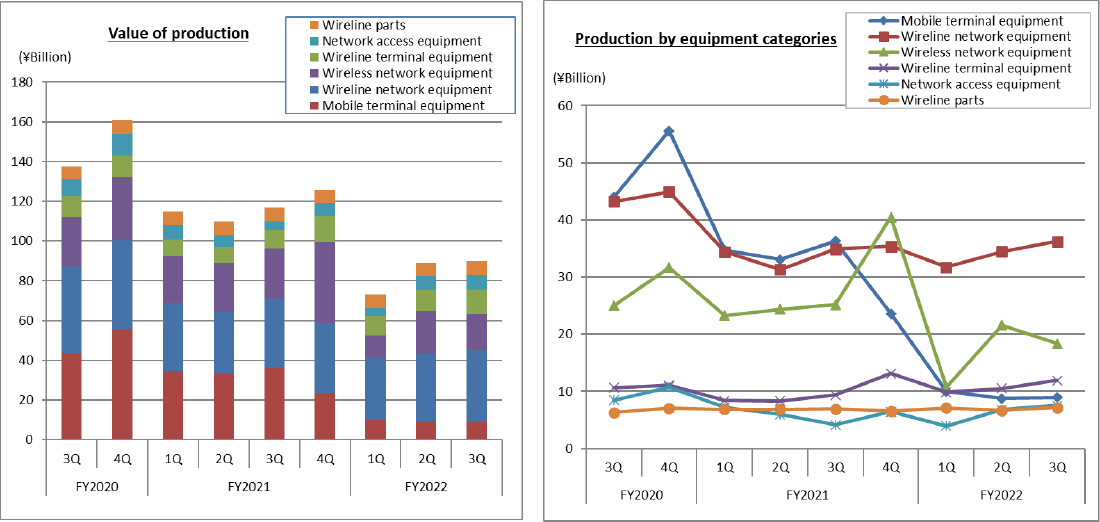
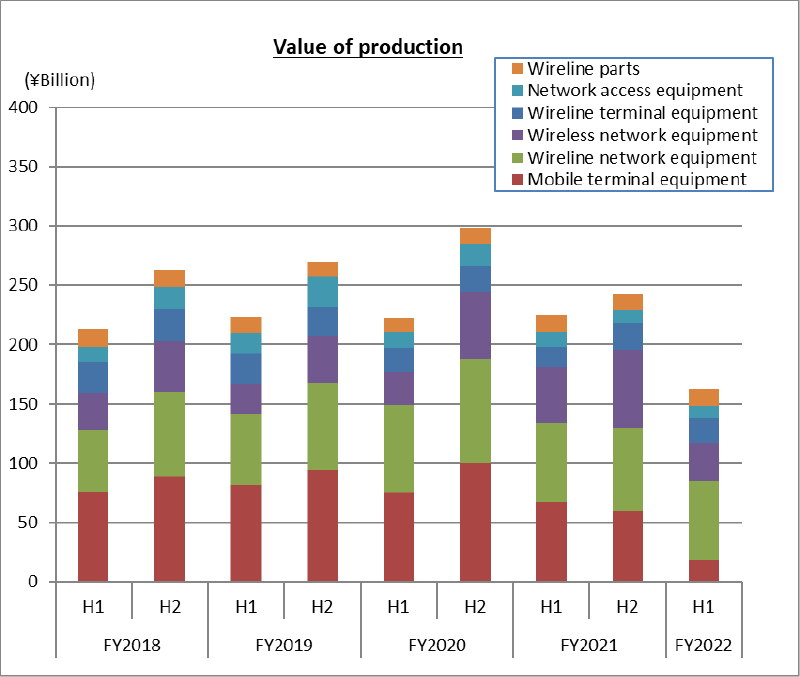
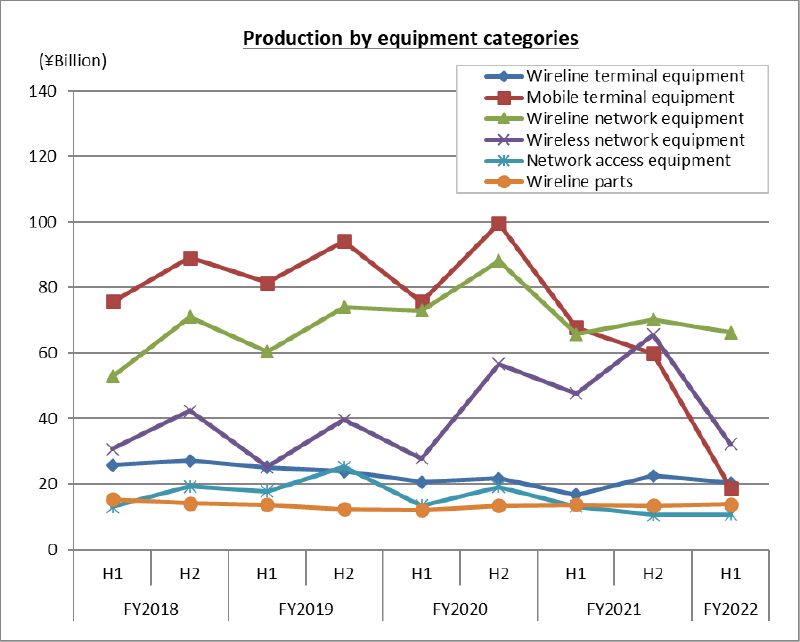
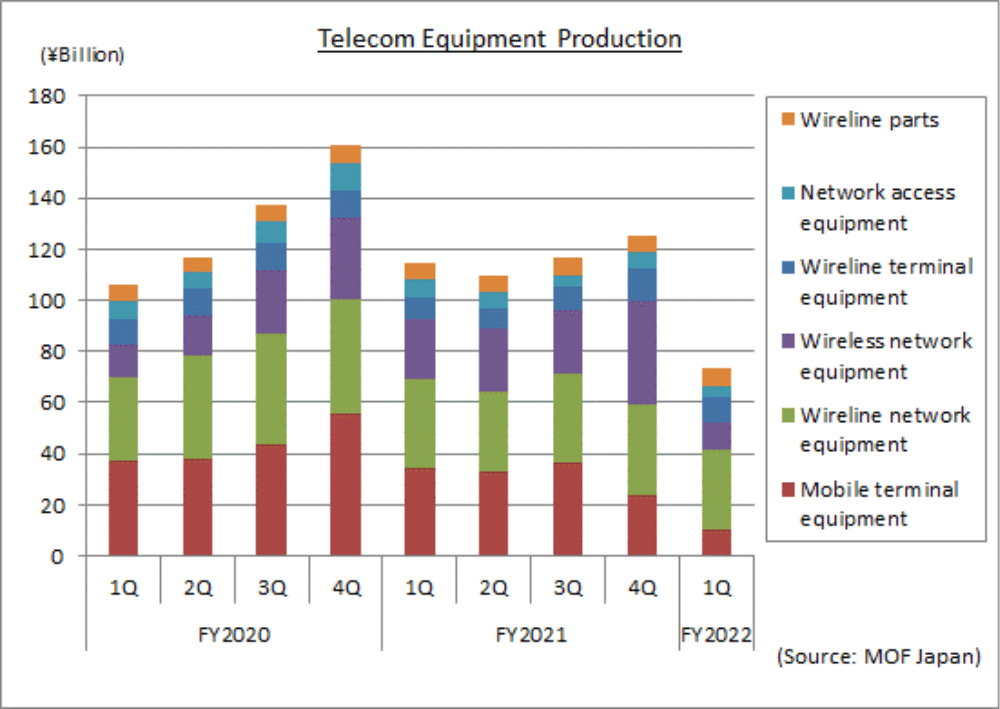
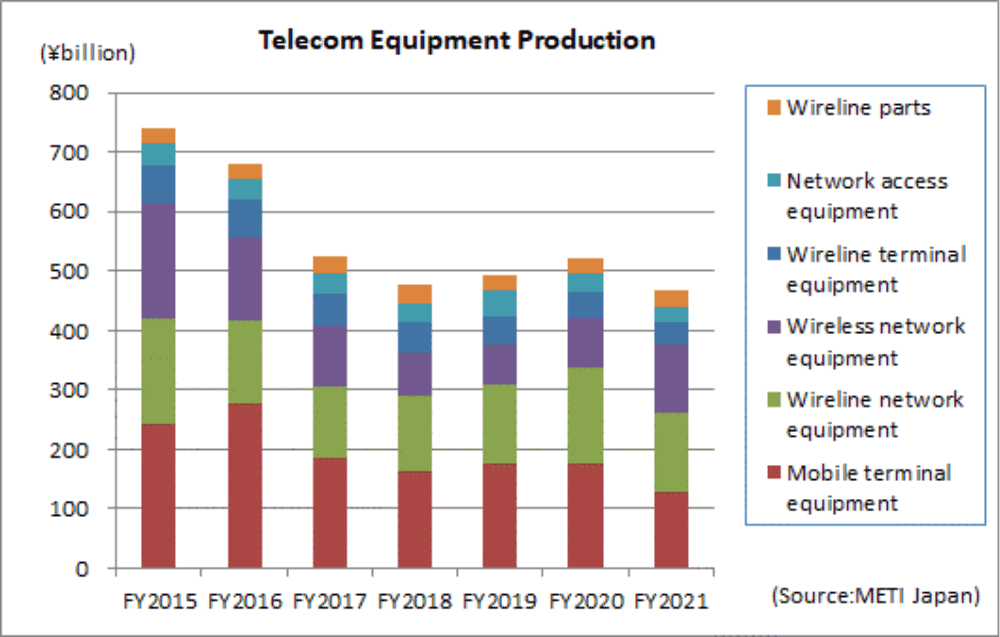
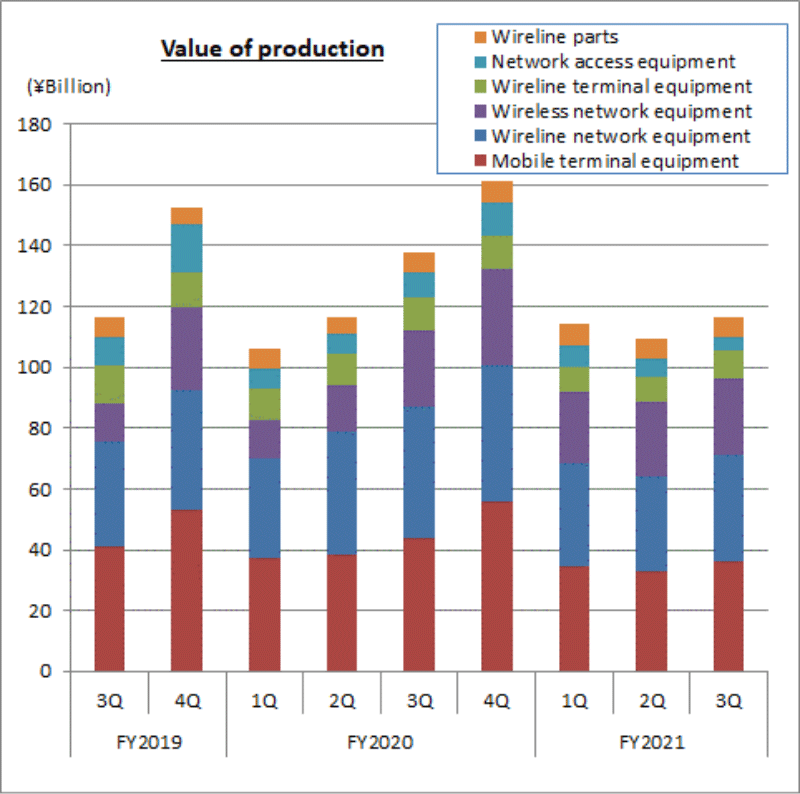
Domestic production totaled 116.7 billion yen in October through December, a year-on-year decrease of 15.1%. It has declined for two consecutive quarters. Production decreased due to a fall in production in reaction to the enhancement of networks in the previous year and the impact of a decrease in production caused by restrictions on parts supply.
(3) Export Trends
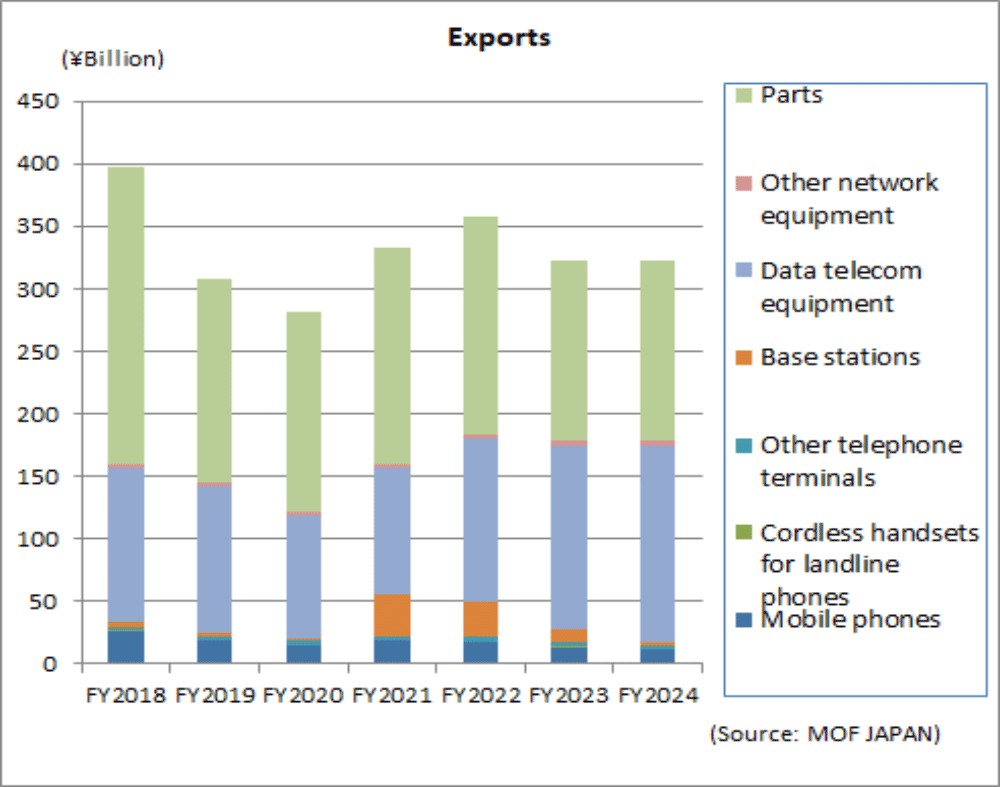
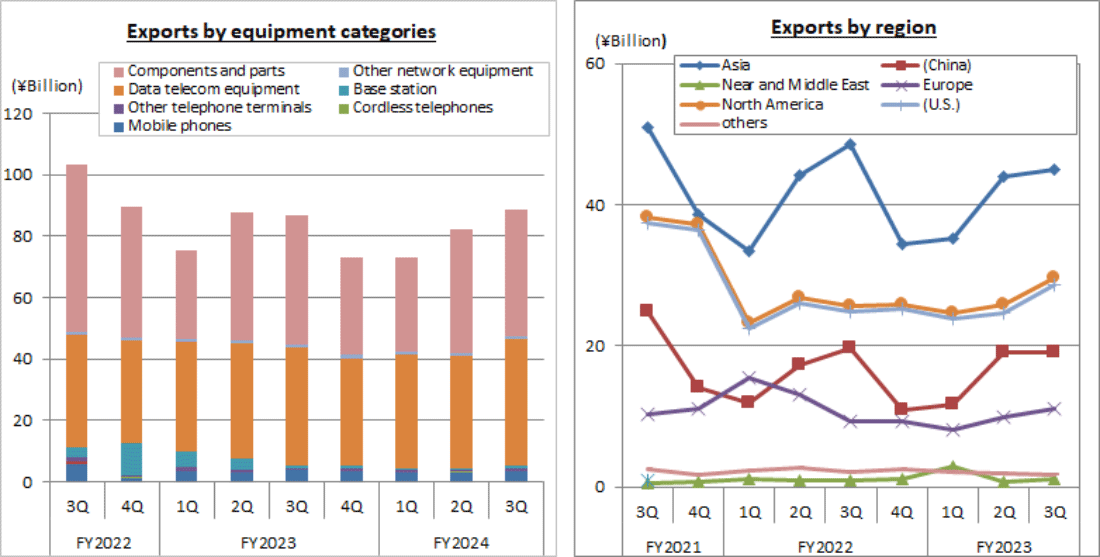
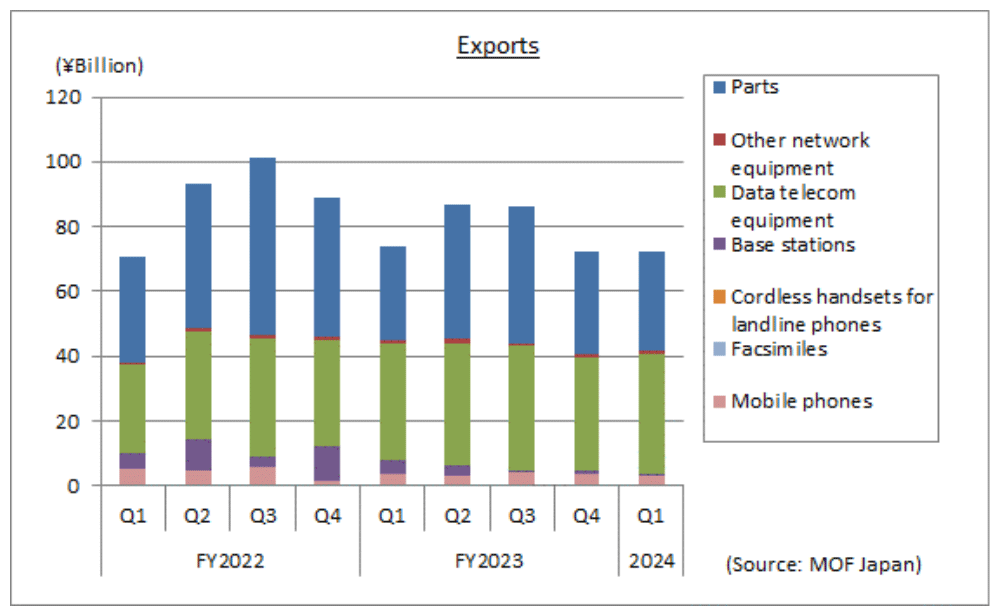
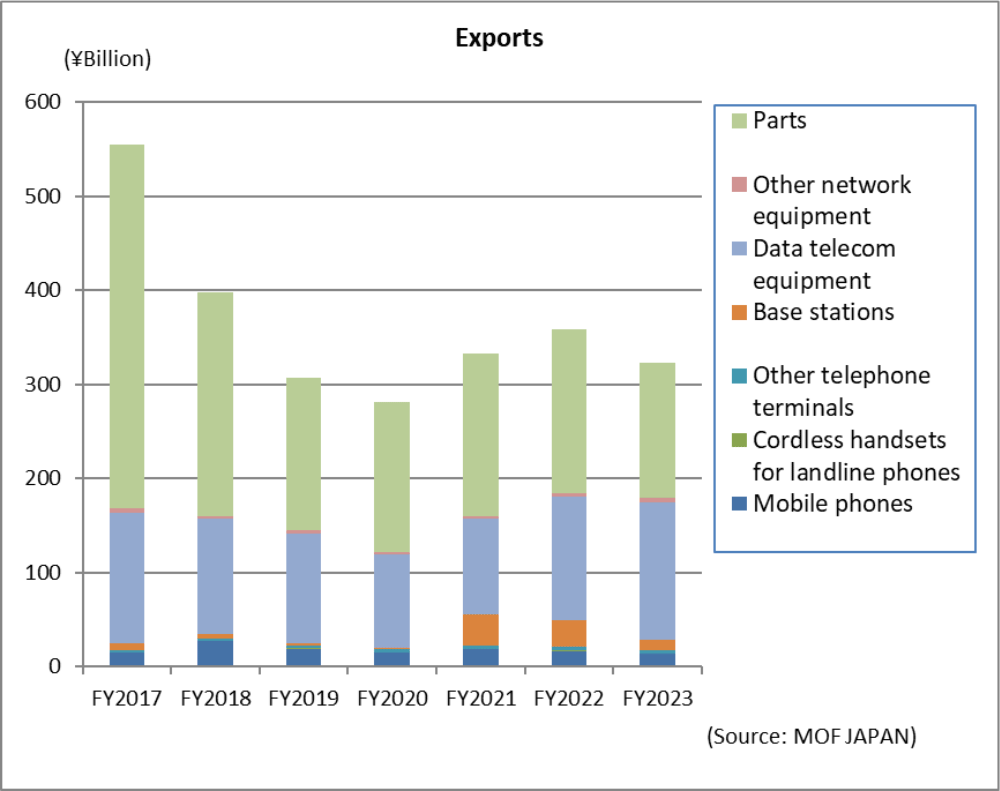
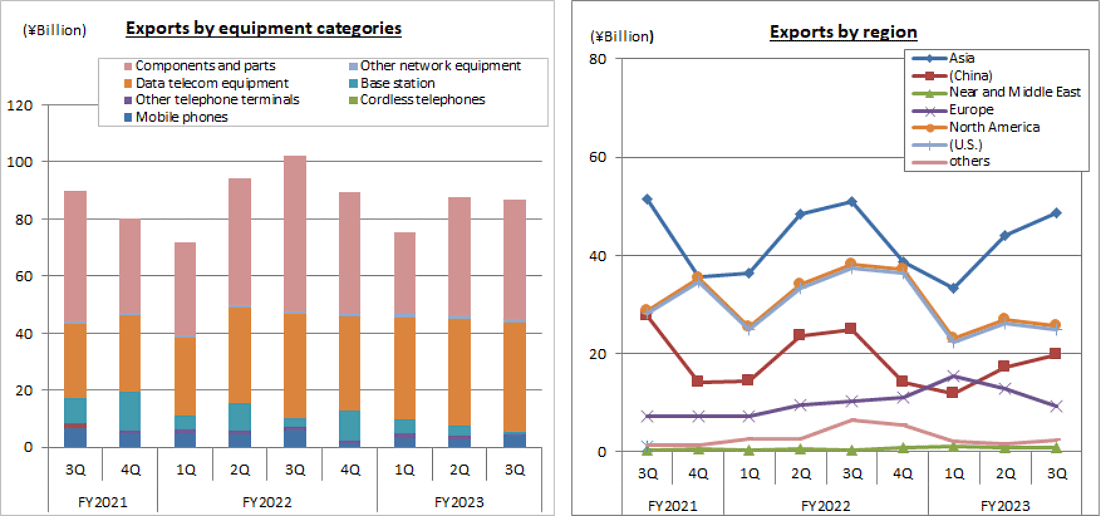
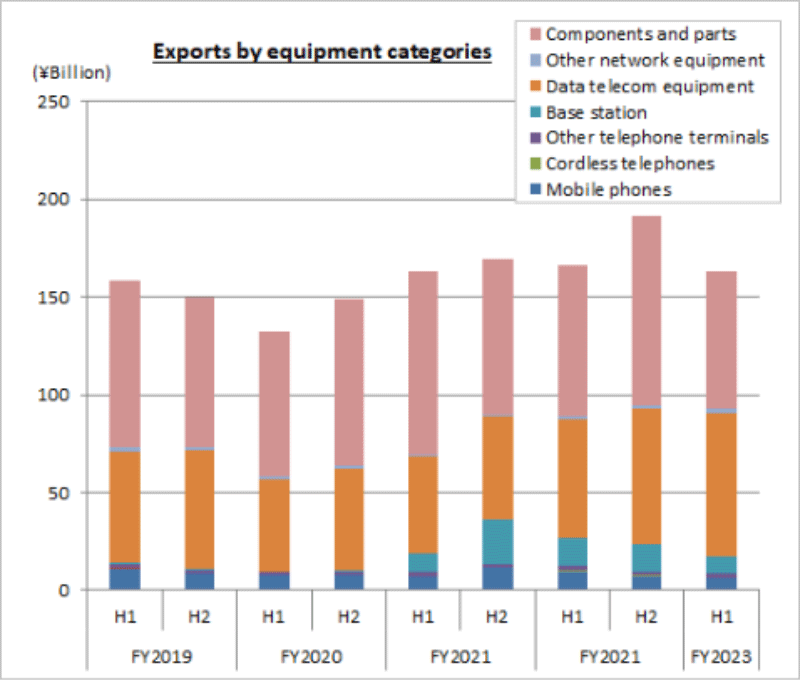
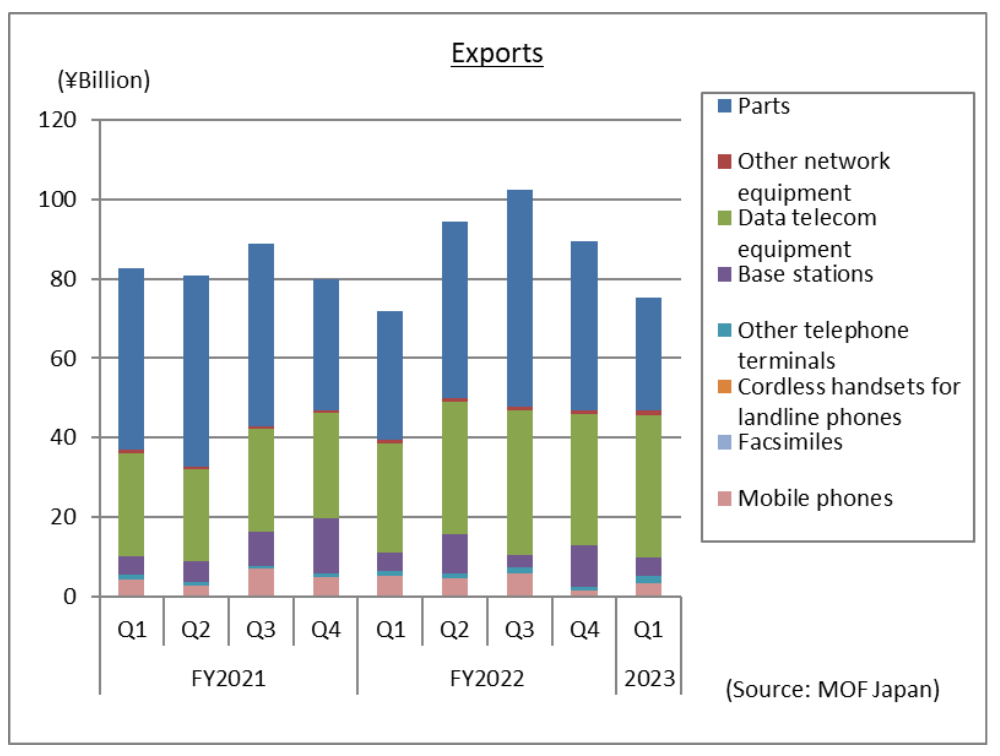
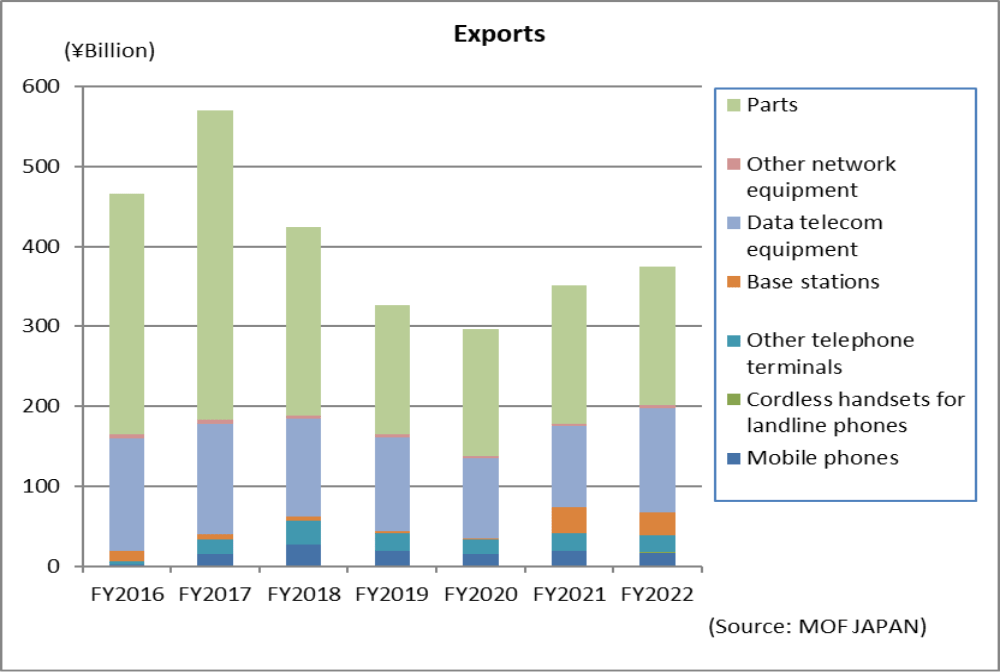
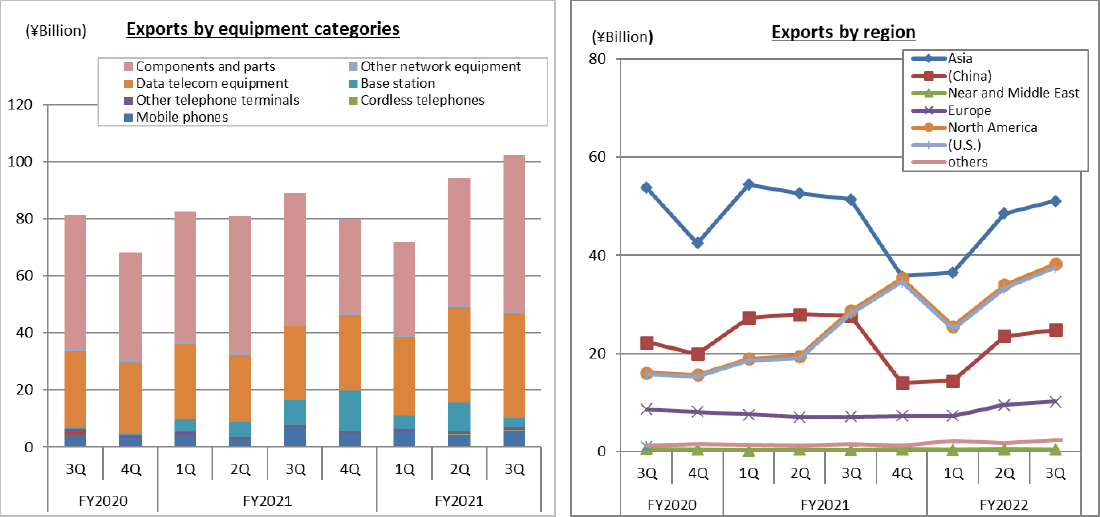
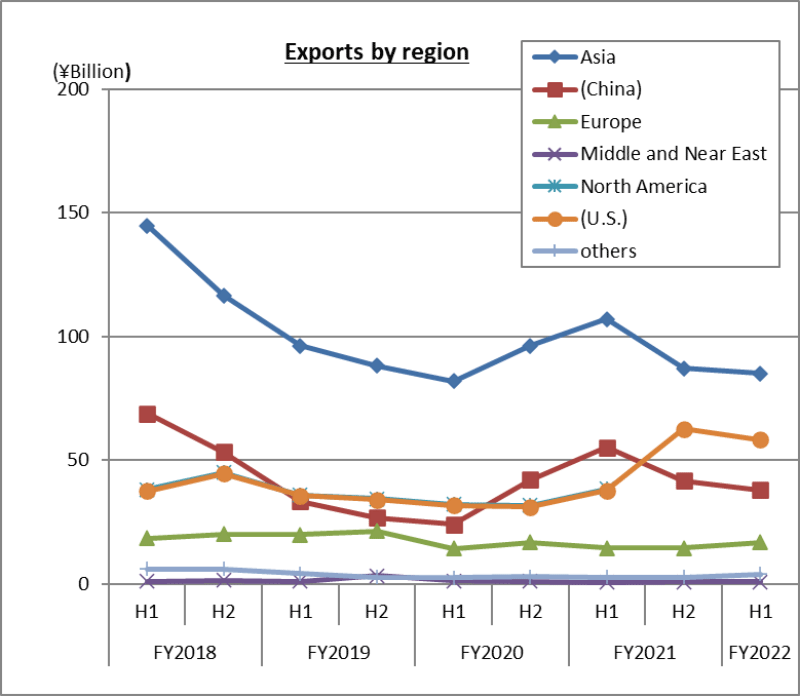
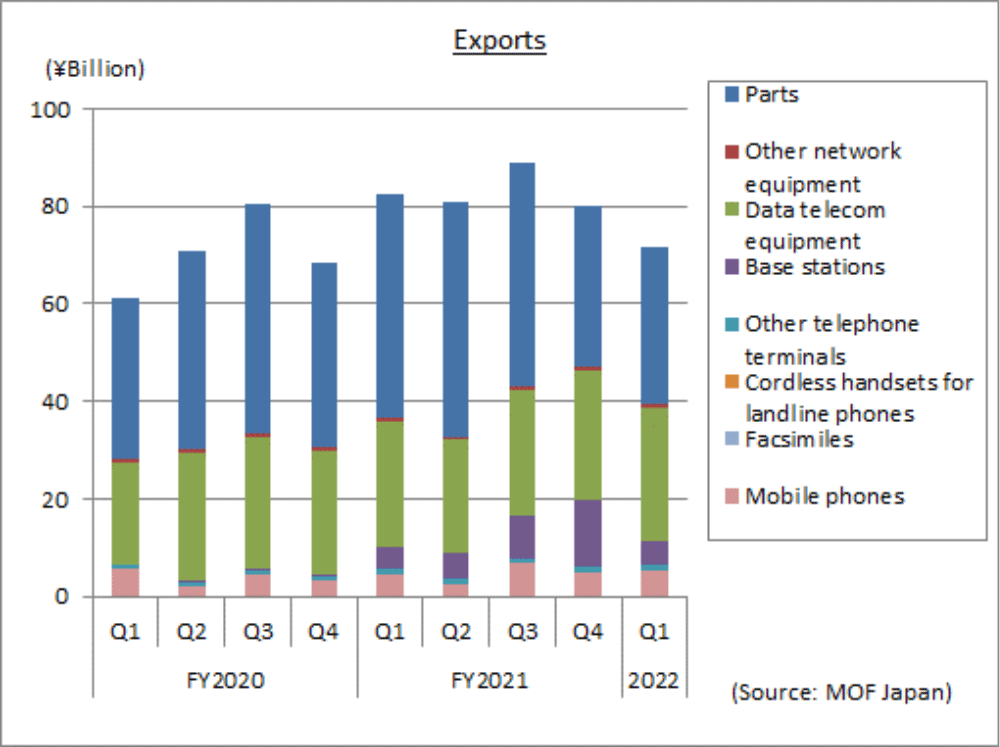
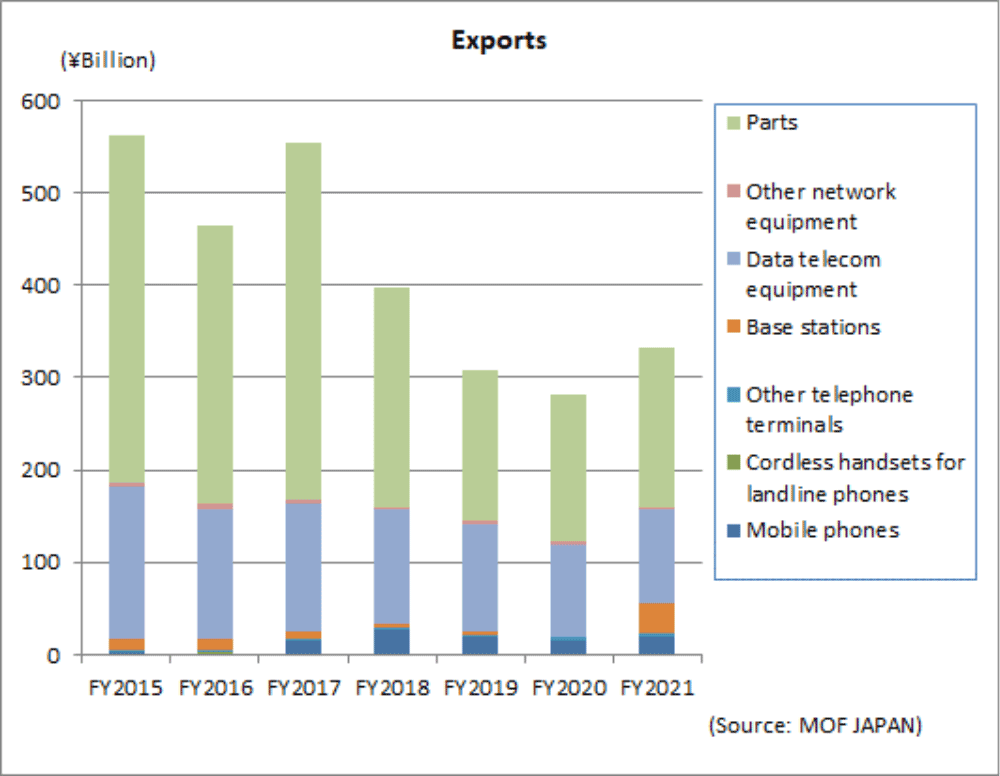
Total exports amounted to 89.0 billion yen for October through December, a year-on-year increase of 10.8%. It has increased for three consecutive quarters. Exports of parts for overseas smartphone production decreased, but shipments of mobile phones and base stations increased.
(4) Import Trends
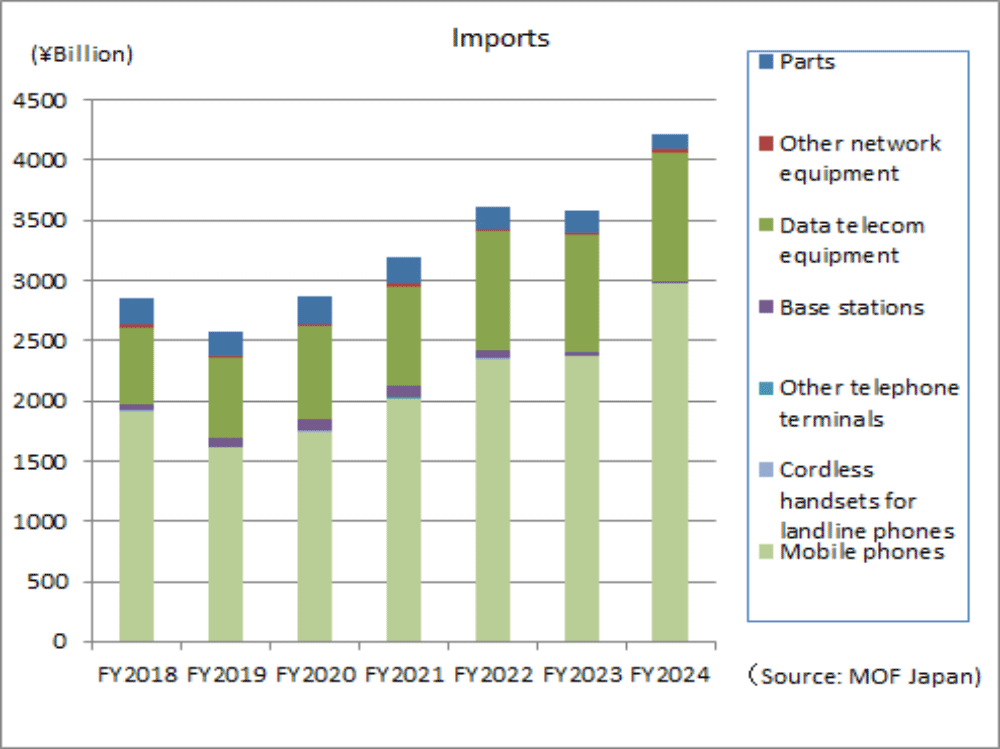
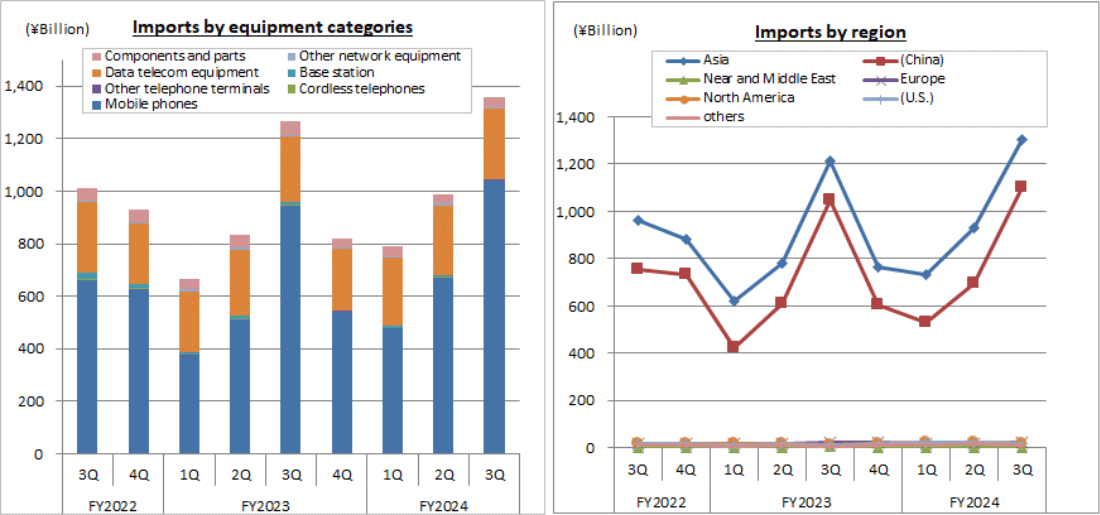
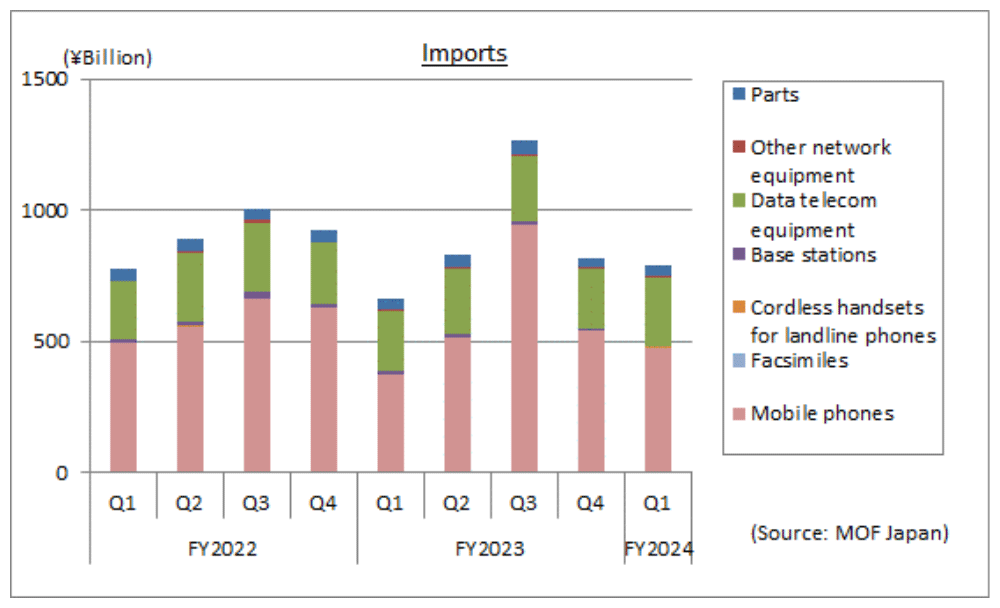
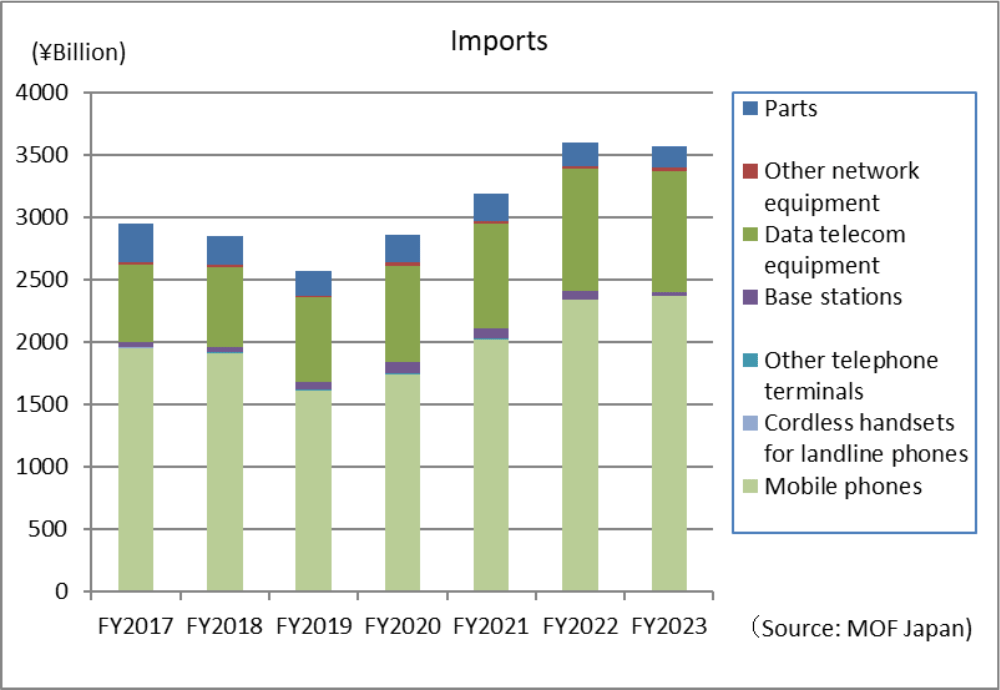
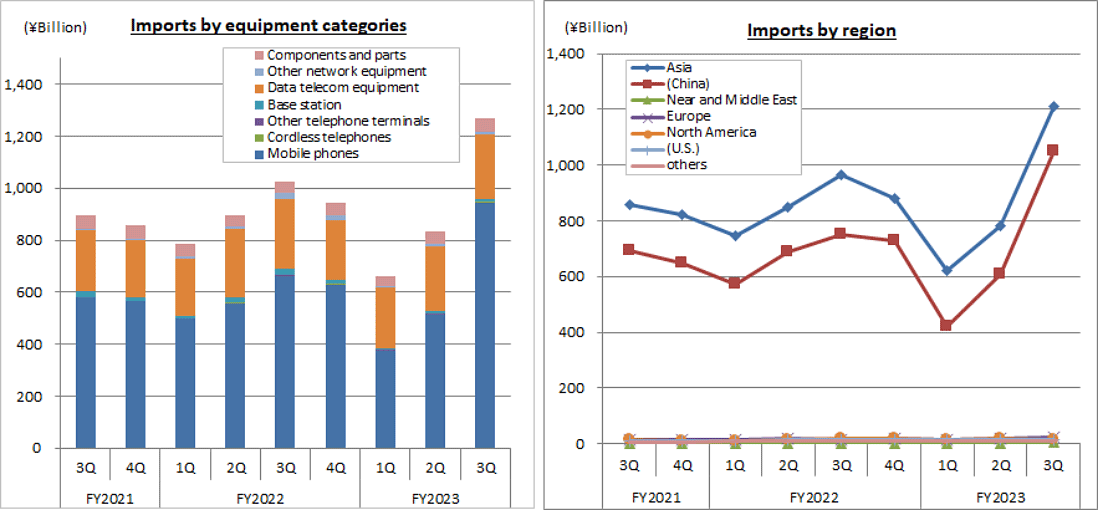
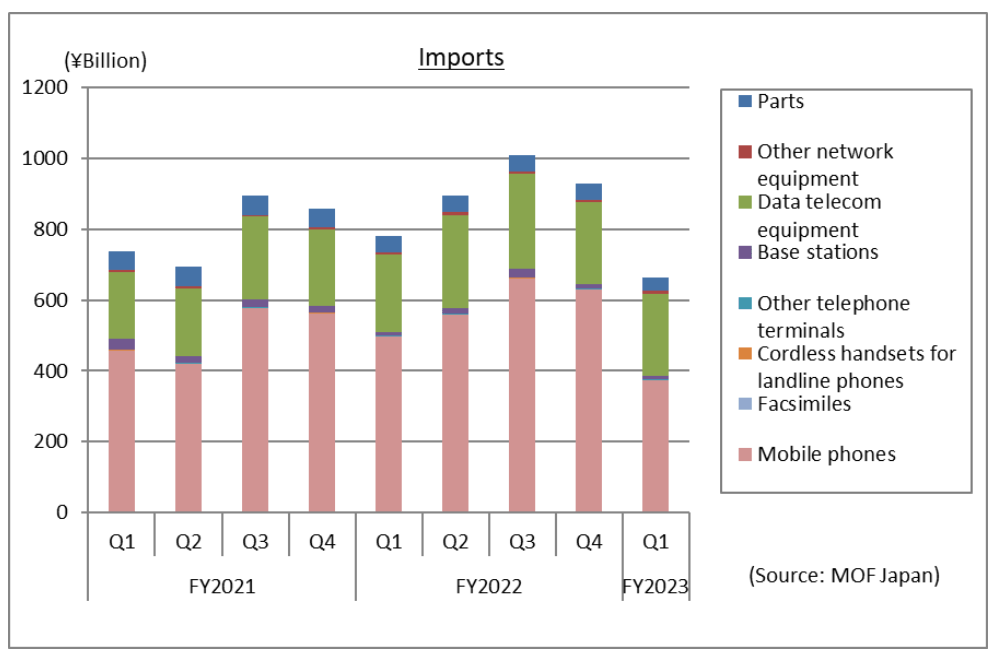
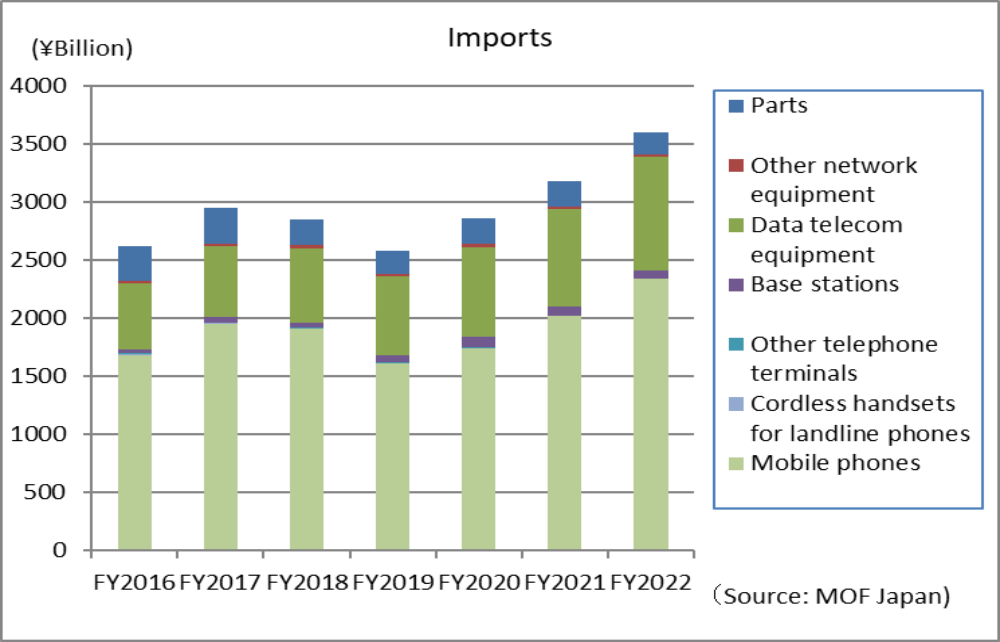
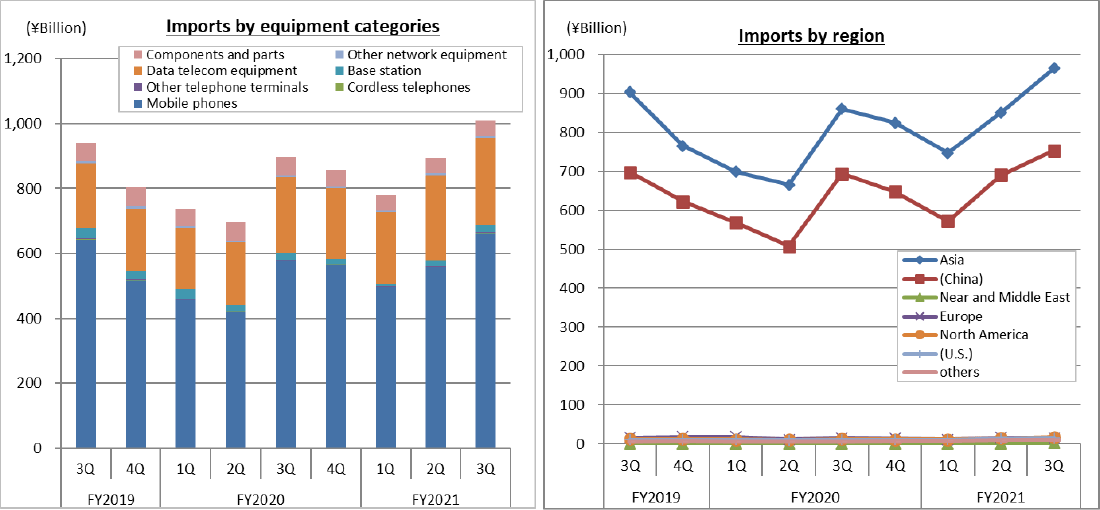
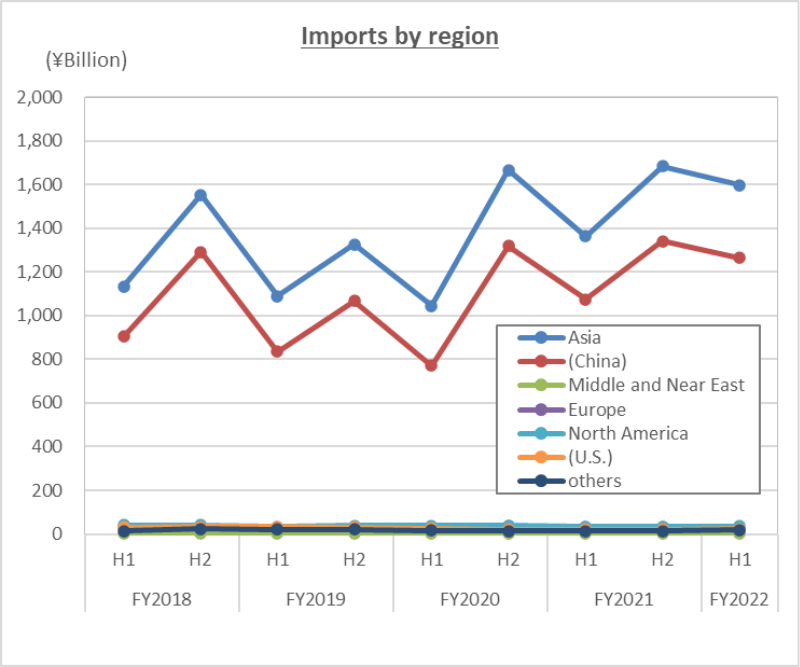
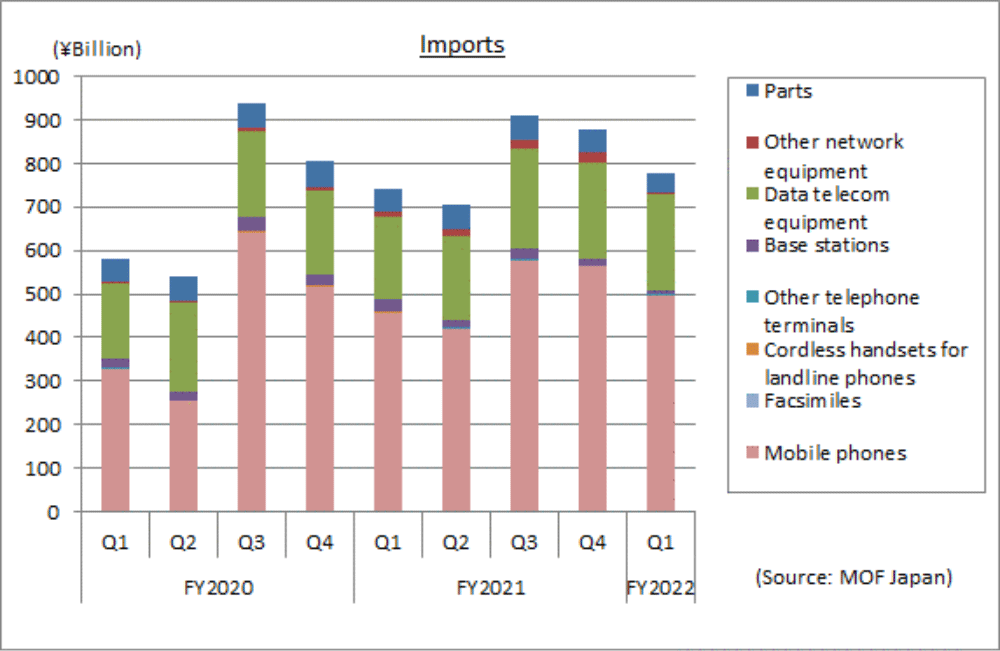
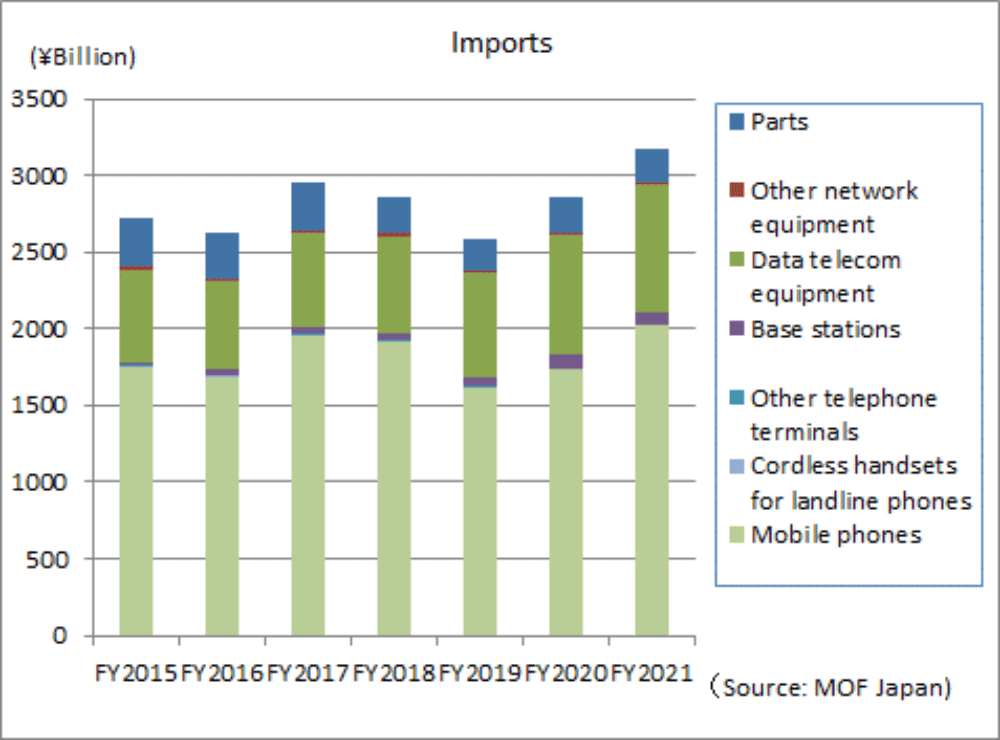
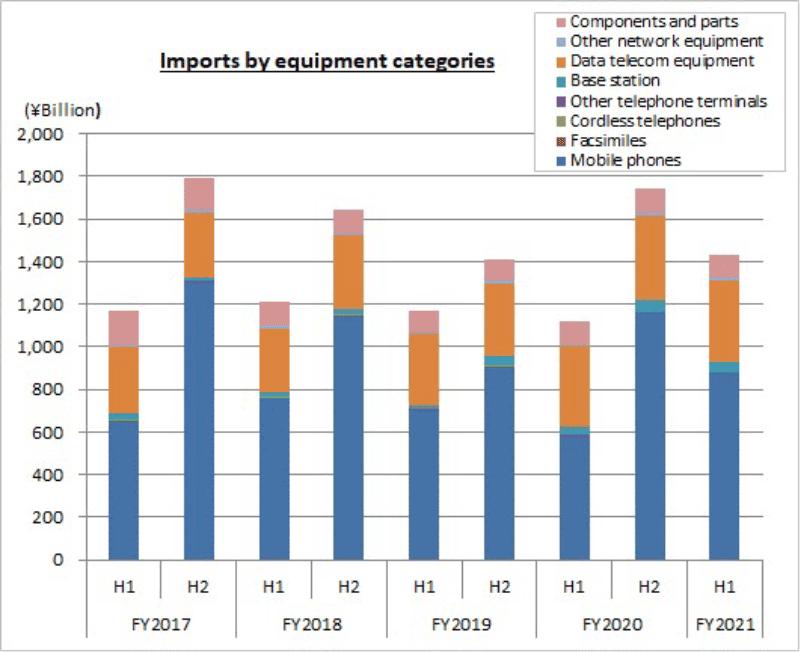
In the October through December period, total imports amounted to 896.3 billion yen, a 4.6% decrease year on year. Data communication equipment increased due to the improvement of capital expenditure in Japan, but mobile phones declined compared to mobile phones from overseas manufacturers that were released in October of the previous year.
II. Domestic Market Trends
(Aggregated by CIAJ based on Indices of Industrial Production and Trade Statistics of Japan)
(1) Detailed trends by category
Actual figures by category for October through December are as follows:
The size of the domestic market (including the value of imports of foreign brands) was calculated from government figures, the Indices of Industrial Production and Trade Statistics of Japan, according to the following formula: Domestic market size = value of domestic production – value of exports + value of imports
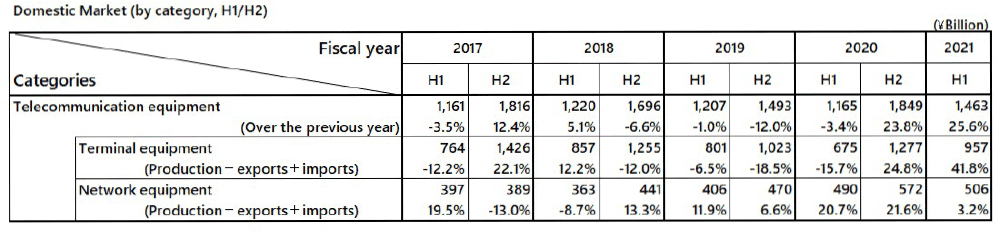
Terminal equipment : 619.1 billion yen (-10.9% over the same period of the previous year)
Network equipment : 289.3 billion yen (+1.0% over the same period of the previous year)
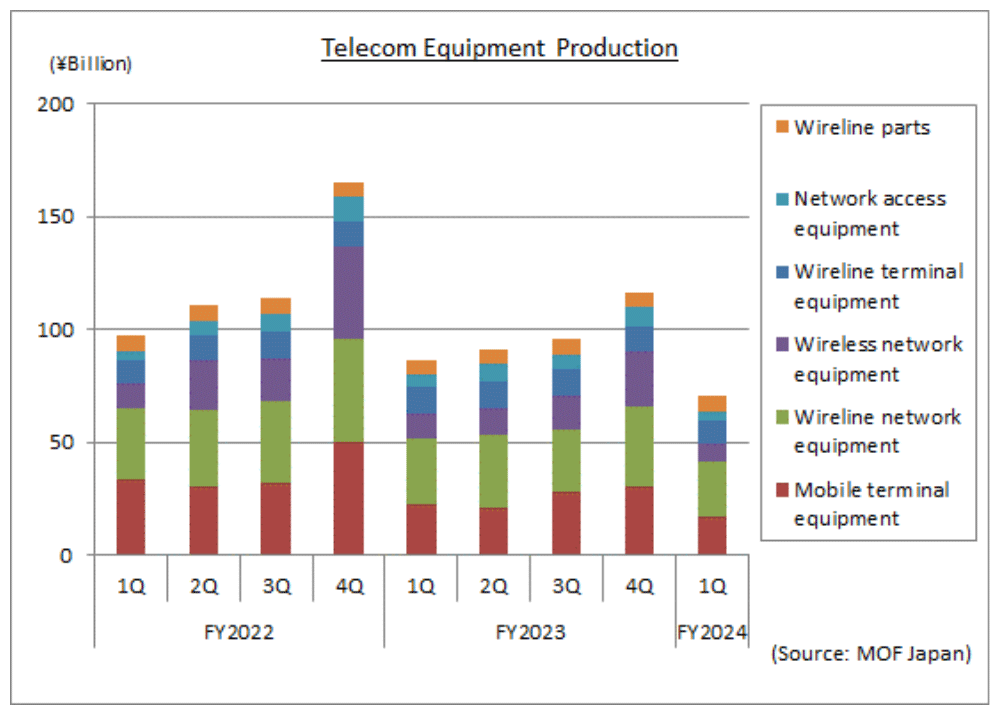
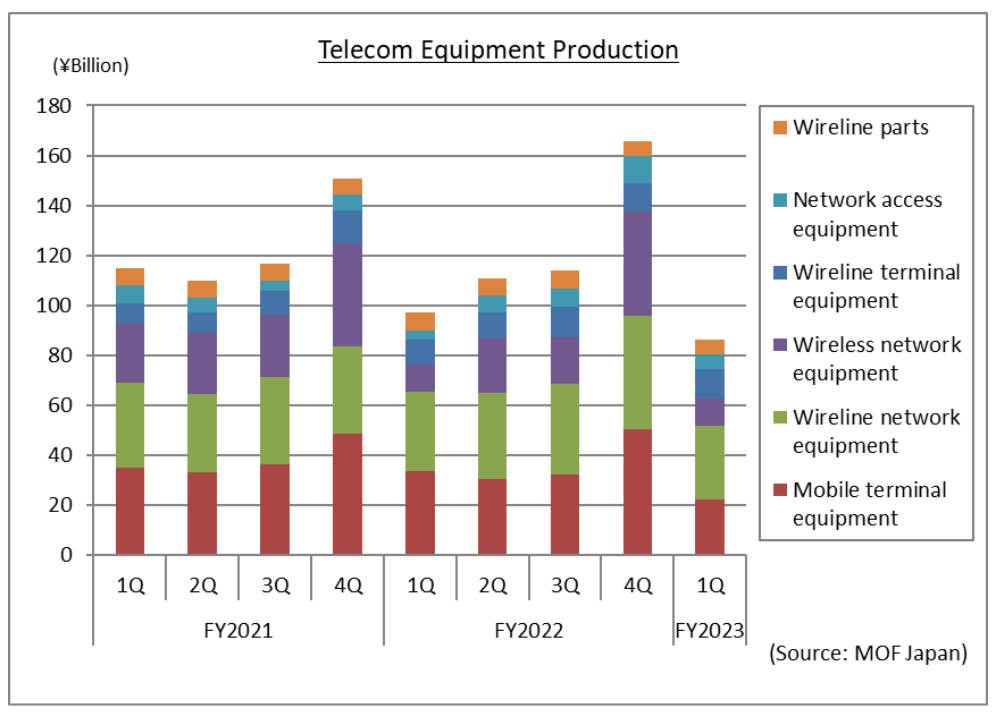
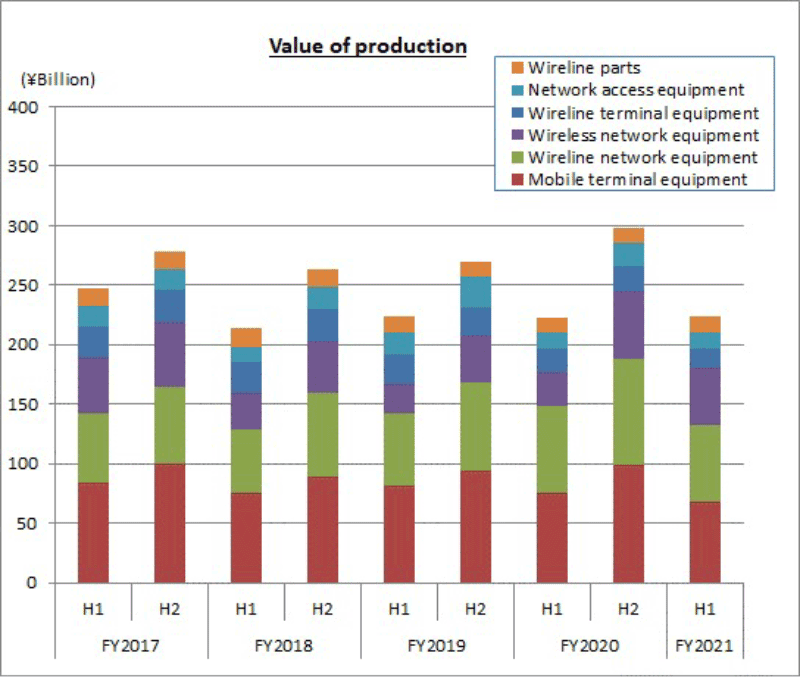
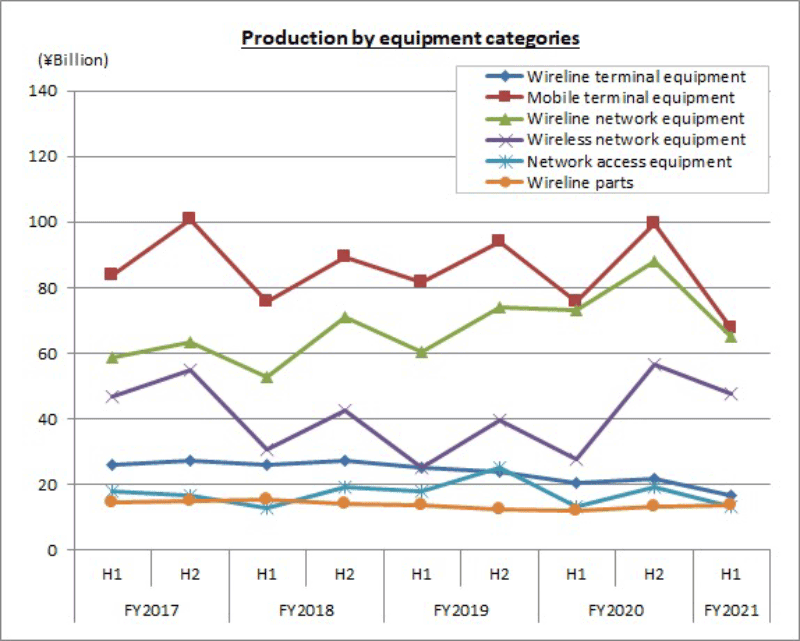
III. Domestic Production
(Based on Indices of Industrial Production compiled by the Ministry of Economics, Trade and Industry)
(1) Detailed trends by category
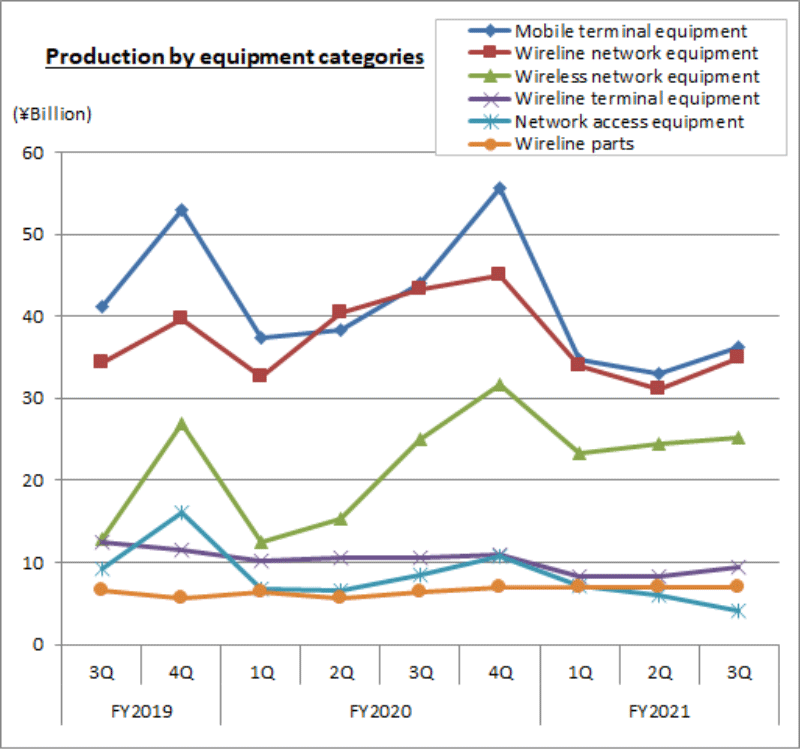
Actual figures by category for October through December are as follows
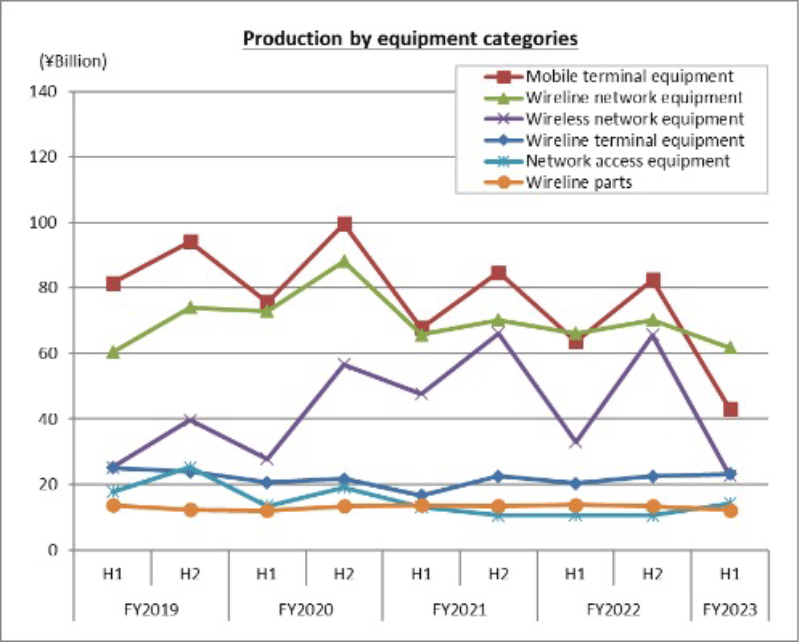
Wireline terminal equipment
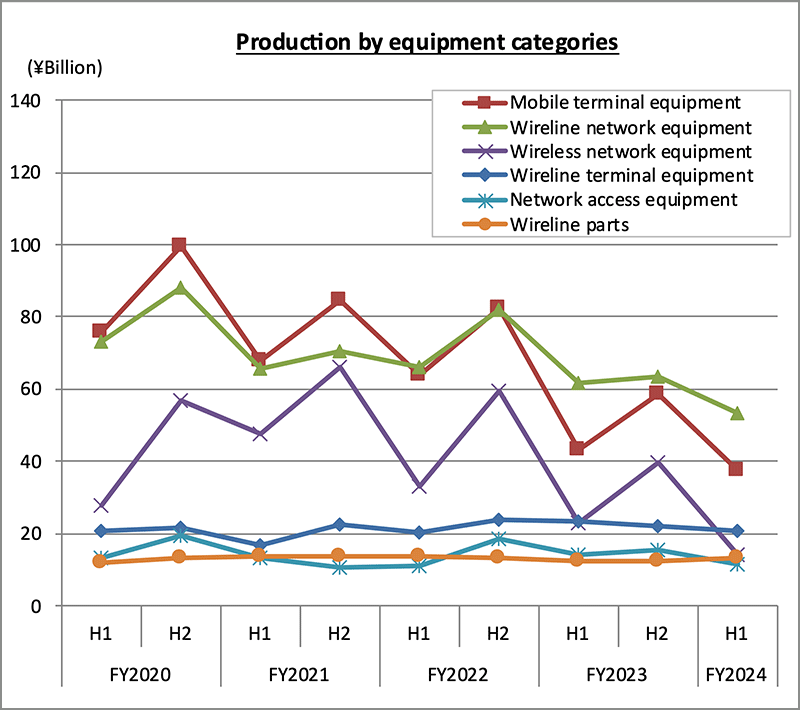
9.4 billion yen (-11.9% over the same quarter of the previous year). Of this, telephone sets was 0.4 billion yen (-22.7% over the same period of the previous year), key telephones 3.1 billion yen (-5.3%), and intercoms 5.8 billion yen (-14.3%). While domestic production is declining due to limited supply of semiconductors and electronic parts, key telephones remained flat year on year during the Apr-Dec period.
Mobile terminal equipment
36.3 billion yen (-17.5% over the same quarter of the previous year). Of which, mobile phones was 27.5 billion yen (-1.1% over the same quarter of the previous year). Domestic production of mobile phones decreased due to a decline in demand that began in the third quarter and a shift to low-priced models. Demand for land telecommunication devices and maritime and aeronautical mobile communications equipment began to recover but domestic production decreased, mainly reflecting restrictions in parts supply.
Wireline network equipment
34.9 billion yen (-19.2% over the same quarter of the previous year). Of this, central office switching systems and private branch exchanges (PBXs) totaled 5.4 billion yen (-31.5% year on year), digital transmission equipment was 16.3 billion yen (-10.9% year on year), and other transmission equipment was 13.2 billion yen (-22.6% year on year). Domestic production of PBXs decreased due to the continued shortage of semiconductors. Domestic production of digital transmission equipment decreased due to a reactionary fall from the same quarter of the previous year and restrictions in supply attributed to the semiconductor shortage.
Wireless network equipment
25.2 billion yen (+0.8% over the same quarter of the previous year). Of which, fixed telecommunication devices were 5.6 billion yen (-18.9% over the same quarter of the previous year) and base station equipment was 19.6 billion yen (+8.2% over the same quarter of the previous year). Domestic production of fixed communications equipment decreased, reflecting a decline in demand for products for government offices and products for the private sector. Domestic production of base station communications equipment continued to increase thanks to the full-scale investment in base stations for commercial 5G services.
Network access equipment
4.1 billion yen (-51.2% over the same quarter of the previous year) Demand for products for the private sector was sluggish due to the COVID-19 pandemic, and domestic production decreased primarily due to limited parts supply.
Wireline parts (relays and repeaters for wired equipment)
6.9 billion yen (+9.3% over the same quarter of the previous year). Domestic production of wireline parts increased, reflecting the need to resolve the domestic parts supply problem and export them for overseas smartphone production.
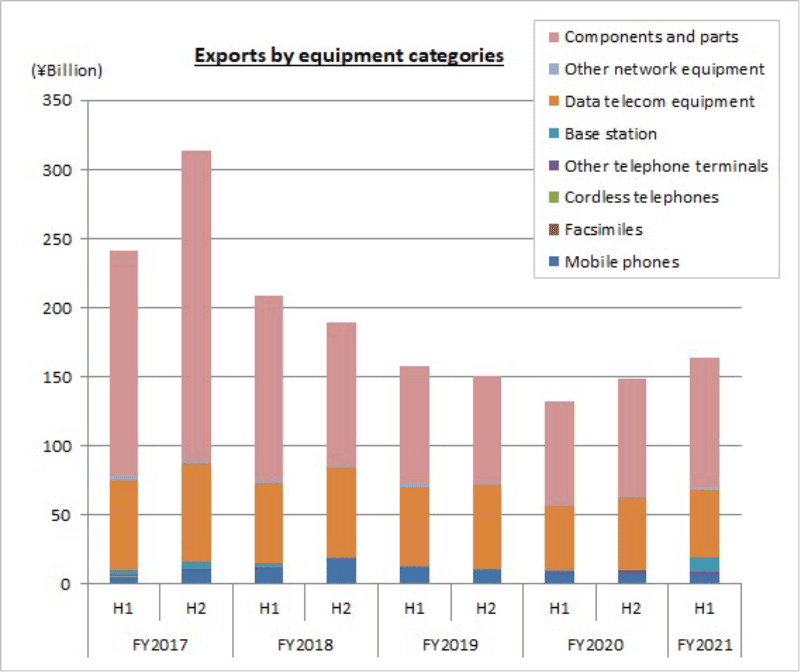
IV. Exports
(Compiled by CIAJ, based on Ministry of Finance’s “Trade Statistics”)
(1) Detailed trends by category
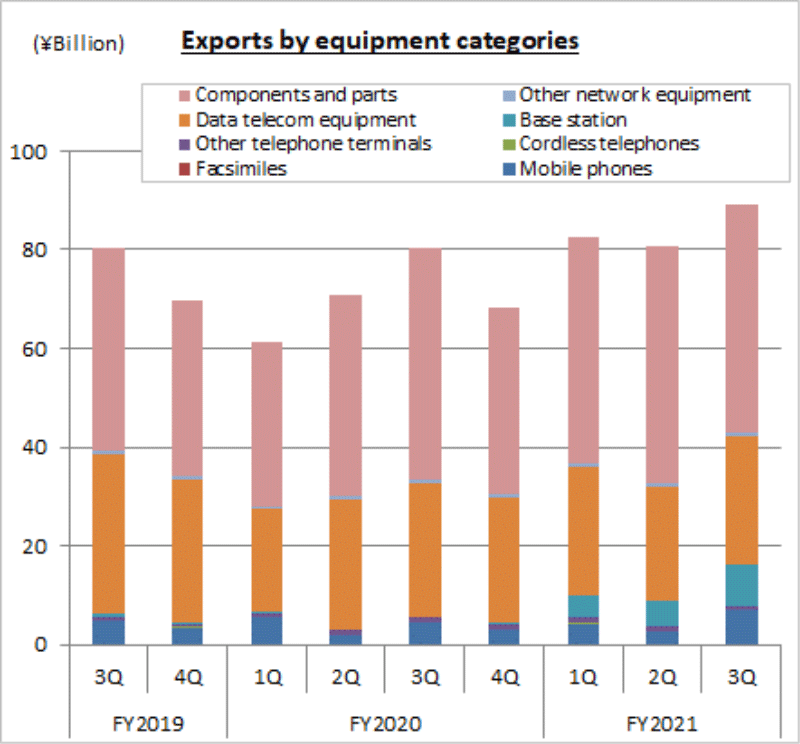
Actual figures by category from October to December are as follows:
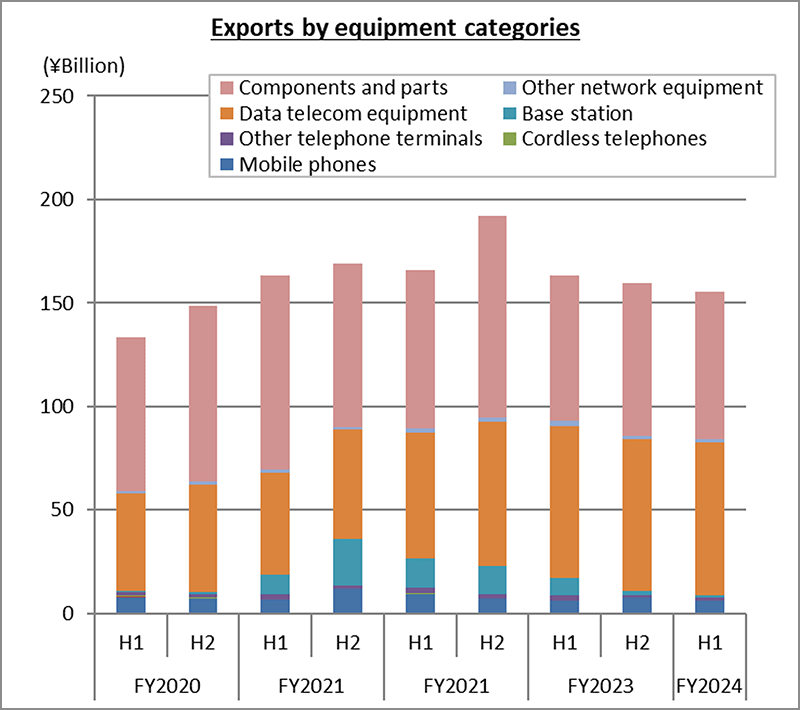
Telephone sets and terminal equipment 7.7 billion yen (-43.2% over the same quarter of the previous year).
Of which, mobile phones was 6.9 billion yen (+59.5% over the same quarter of the previous year), cordless handsets for landline phones was 10 million yen (-86.4% over the same quarter of the previous year), and other was 800 million yen (-21.8% over the same quarter of the previous year). Mobile phones were exported mostly to the U.S., and the exports increased.
Network equipment 35.2 billion yen (+25.4% over the same quarter of the previous year).
Of which, base stations was 8.7 billion yen (+4177.5% over the same quarter of the previous year), data communication equipment was 26.0 billion yen (-4.3% over the same quarter of the previous year) and other network equipment was 600 million yen (-19.7% over the same quarter of the previous year). Base stations were exported mostly to the U.S., and exports increased significantly.
Parts (both wireline and wireless) 46.1 billion yen (-1.7% over the same period of the previous year)
Overseas smartphone production began to decline in the third quarter and export of components for smartphone production decreased.
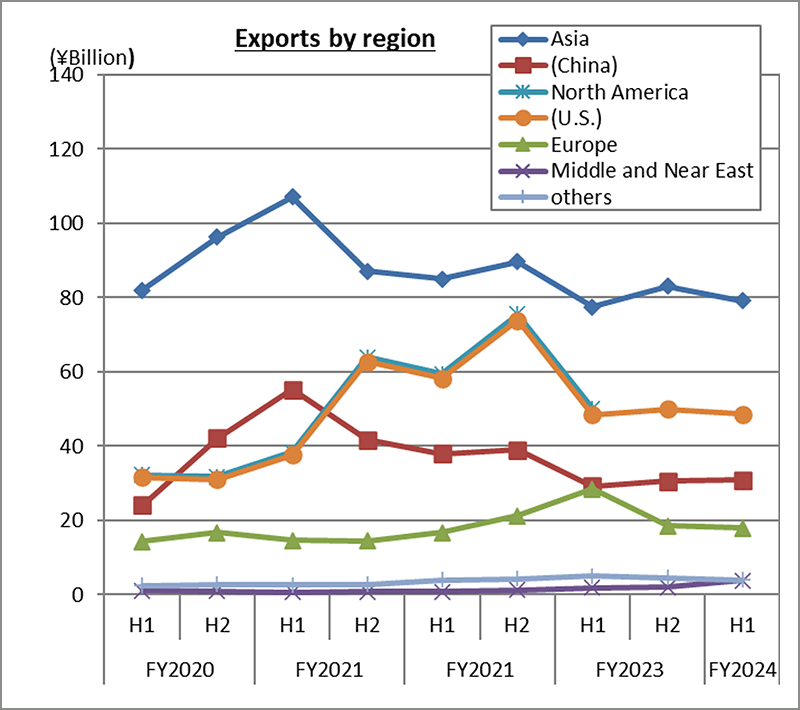
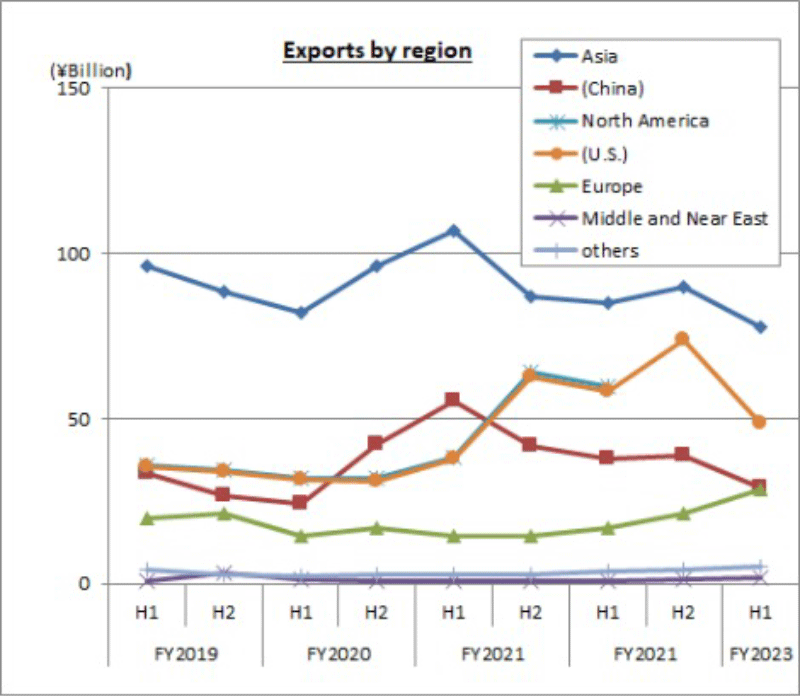
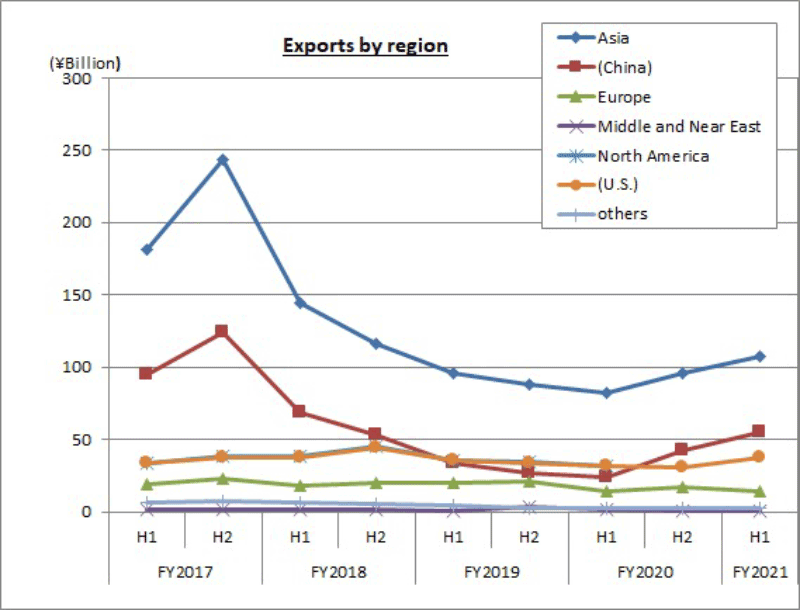
(2) Detailed trends by region
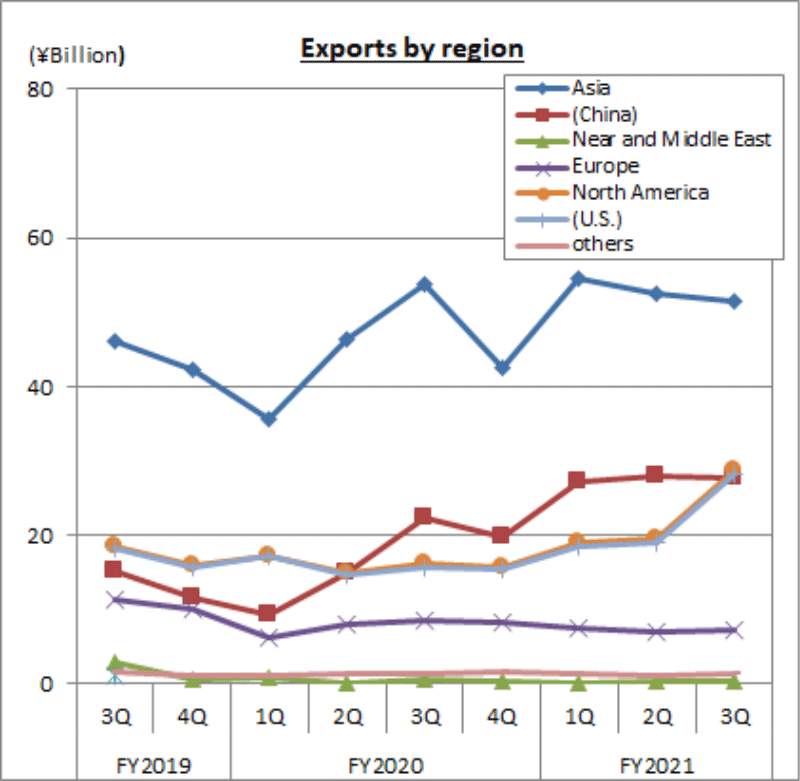
The results by region for the October through December period include 51.4 billion yen for Asia (-4.4% year on year), in which exports to China totaled 27.7 billion yen (+24.3% year on year). North America was 28.7 billion yen (+78.7% over the same quarter of the previous year), of which the U.S. was 28.1 billion yen (+79.1% over the same quarter of the previous year). Europe was 7.2 billion yen (-17.1% over the same quarter of the previous year), of which the EU was 5.0 billion yen (-15.2% over the same quarter of the previous year). Among exports to the U.S., exports of mobile phones and base stations increased significantly. Exports of components for China increased in line with the recovery of the Chinese economy.
(3) Comparison and breakdown by region
| First: | Asia | 57.7% (-9.2% over the same period of the previous year) |
| Second: | North America | 32.3% (+12.3% over the same period of the previous year) |
| Third: | Europe | 8.0% (-2.7% over the same period of the previous year) |
| Other regions | 1.7% (+0.1% over the same period of the previous year) |
V. Imports
(Compiled by CIAJ, based on Ministry of Finance’s “Trade Statistics”)
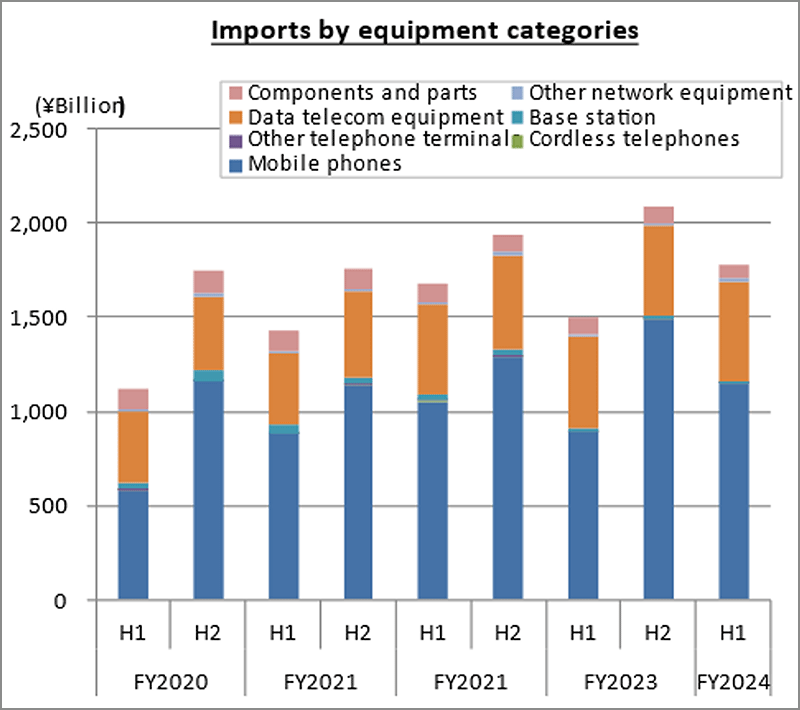
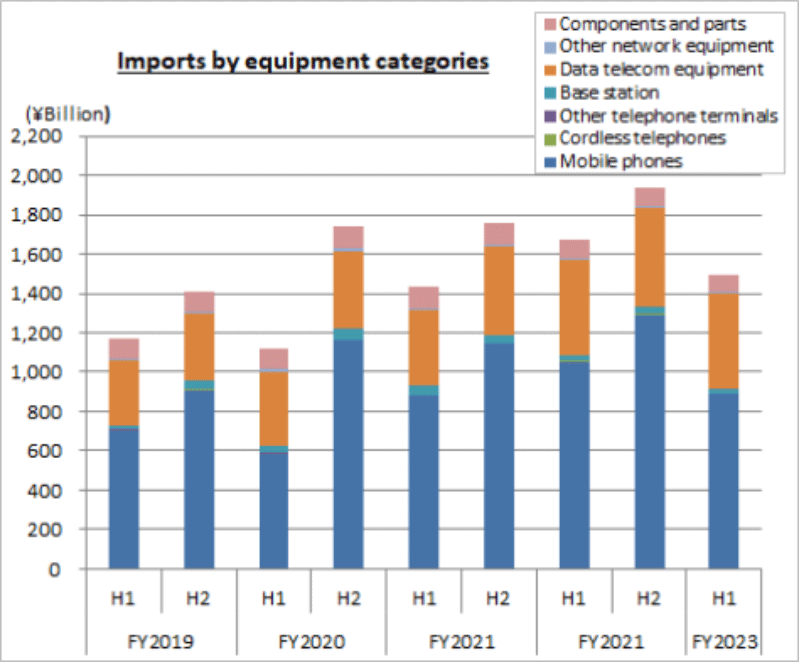
(1) Detailed trends by category
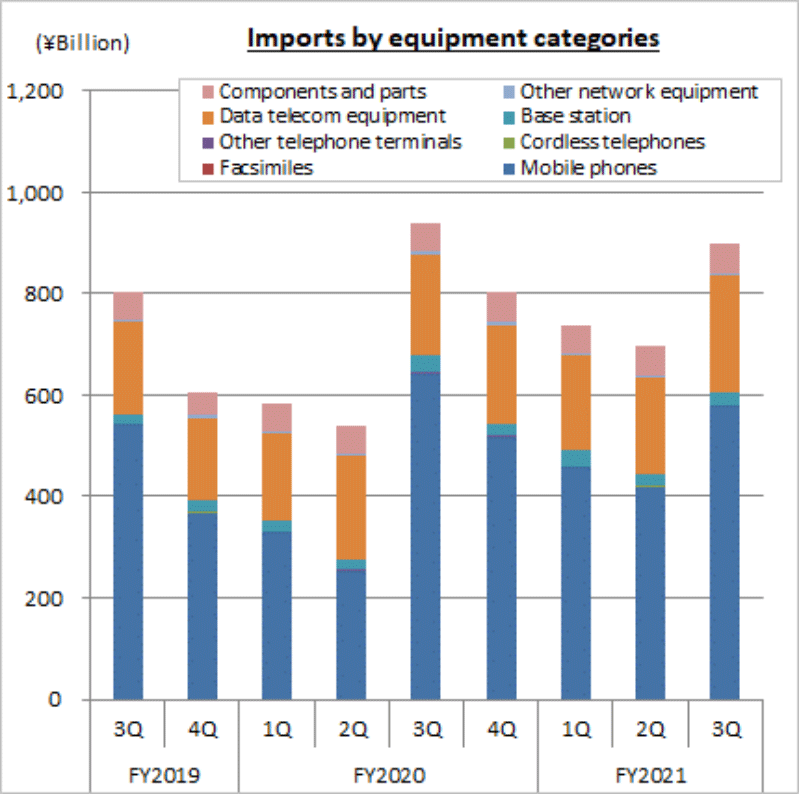
Actual figures by category from October to December are as follows:
Telephone sets and terminal equipment 580.1 billion yen (-10.0% over the same quarter of the previous year).
Of this, mobile phones was 577.9 billion yen (-9.9% over the same quarter of the previous year), cordless handsets for landline phones was 600 million yen (-61.5% over FY2018), and other was 1.7 billion yen (+5.0% over the same quarter of the previous year). Imports of mobile phones decreased due to the decline in domestic demand that began in the third quarter. Imports of cordless handsets for landline phones decreased, reflecting stagnant production at overseas plants attributed to shortage of parts supply and labor.
Network equipment 260.3 billion yen (+9.4% over FY2020)
Of this, base stations was 23.1 billion yen (-28.5% over FY2020), data communication equipment was 231.7 billion yen (+16.5% over FY2020) and other network equipment was 5.5 billion yen (-17.6% over FY2020). Import of data communication equipment (router switches and other products (transmission equipment, communications equipment, modems, etc.)) increased due to capital expenditures for data center equipment, etc.
- Parts (both wireline and wireless) 55.8 billion yen (-2.1% over the same period of the previous year)
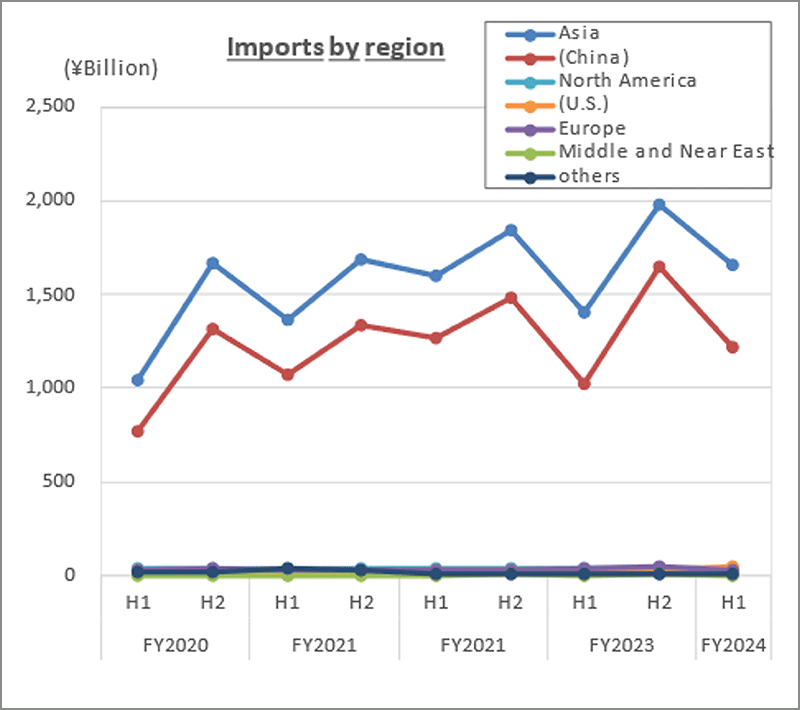
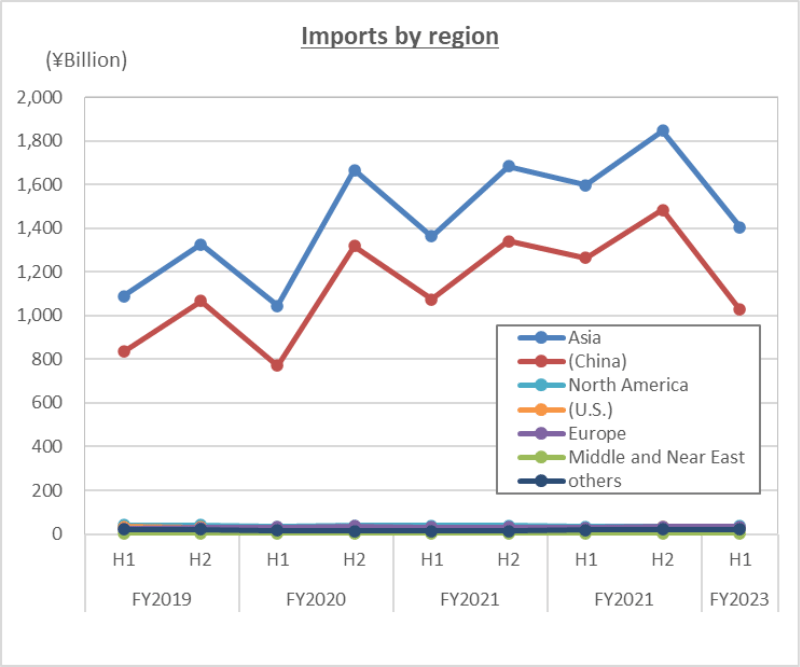
(2) Detailed trends by region
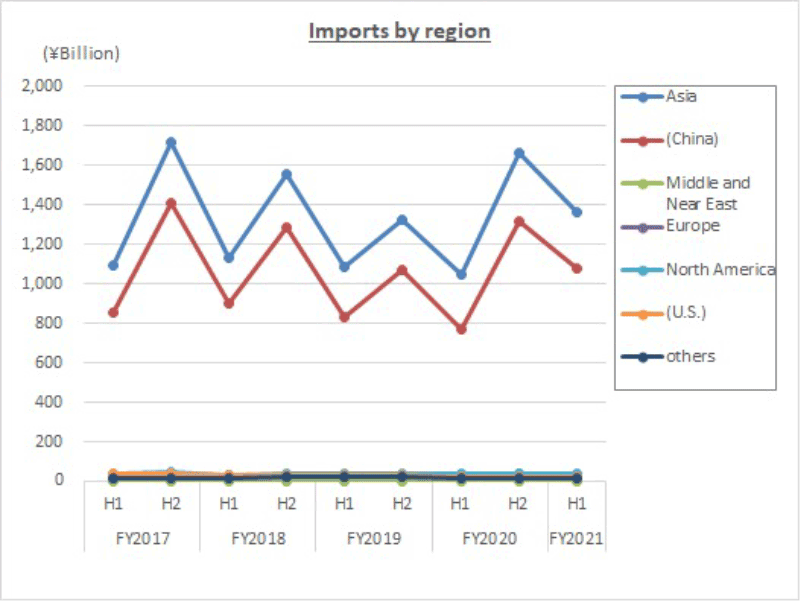
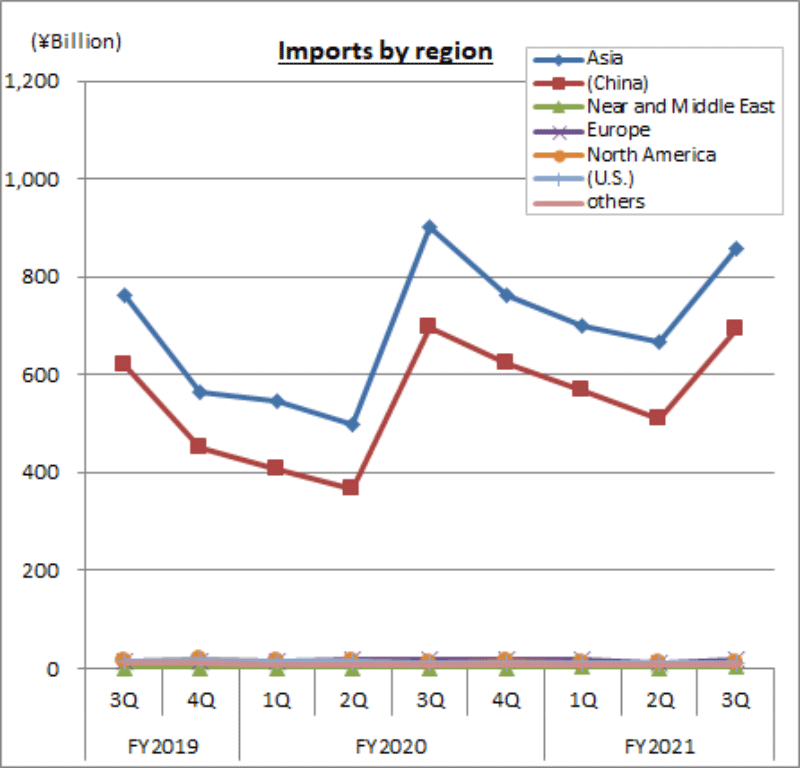
The results by region for the October through December period include 859.2 billion yen from Asia (-4.8% year on year), in which imports from China totaled 692.9 billion yen (-0.6% year on year). North America was 12.3 billion yen (+0.1% over the same quarter of the previous year), of which the U.S. accounted for 10.8 billion yen (-1.2% over the same quarter of the previous year). Europe was 16.2 billion yen (-0.6% over FY2020), of which the EU was 15.5 billion yen (-0.5% over FY2020).
Asia declined year on year due to a decrease in import of mobile phones, offsetting the increase in import of data communication equipment that enjoyed strong demand.
(3) Comparison and breakdown by region
| First: | Asia | 95.9% (-0.2% over the same period of the previous year) |
| Second: | North America | 1.4% (+0.1% over the same period of the previous year) |
| Third: | Europe | 1.8% (+0.1% over the same period of the previous year) |
| Other regions | 0.8% (±0% over the same period of the previous year) |
VI. Trends in Orders Received and Shipped
(1) Results in October through December, 2021
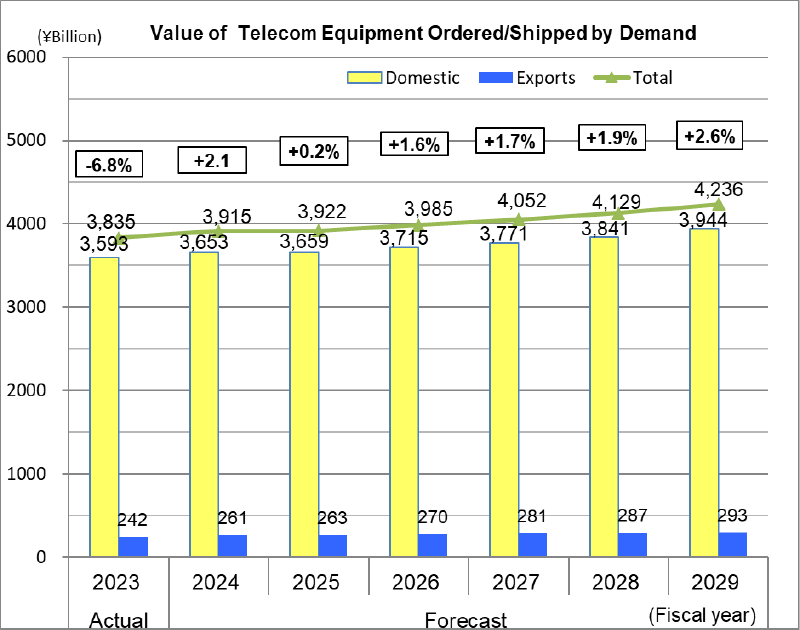
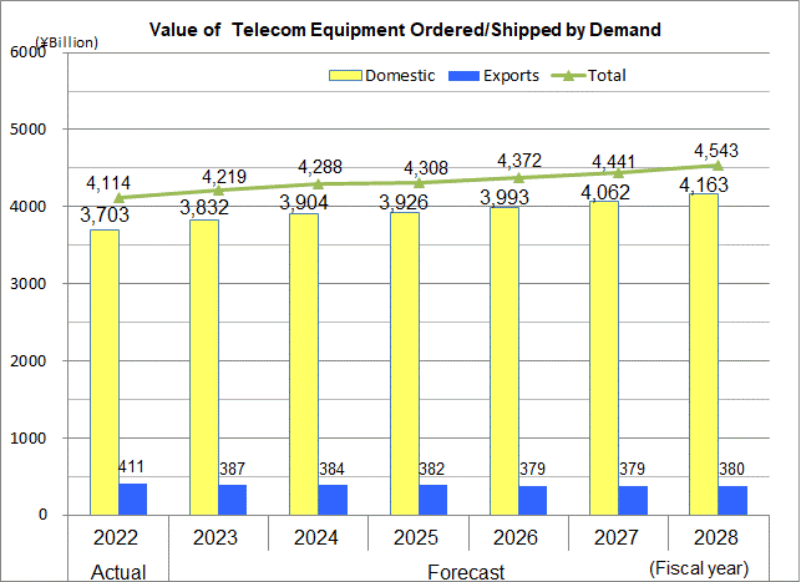
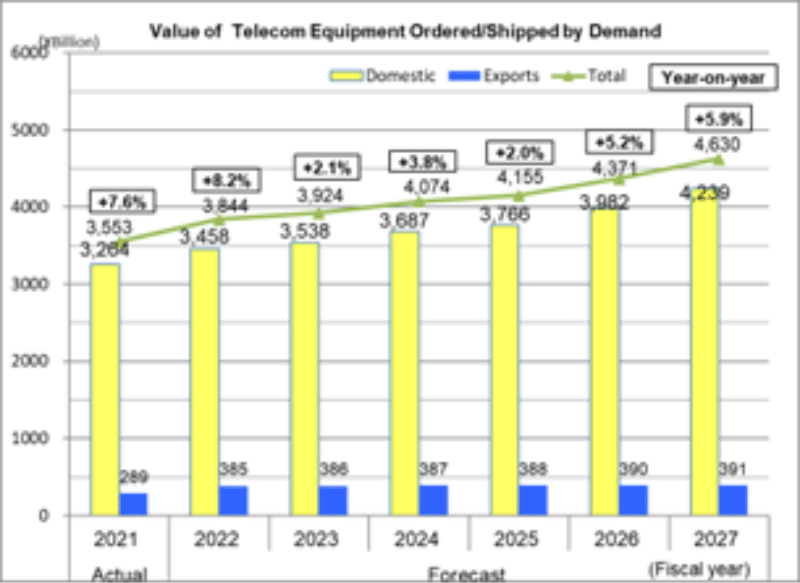
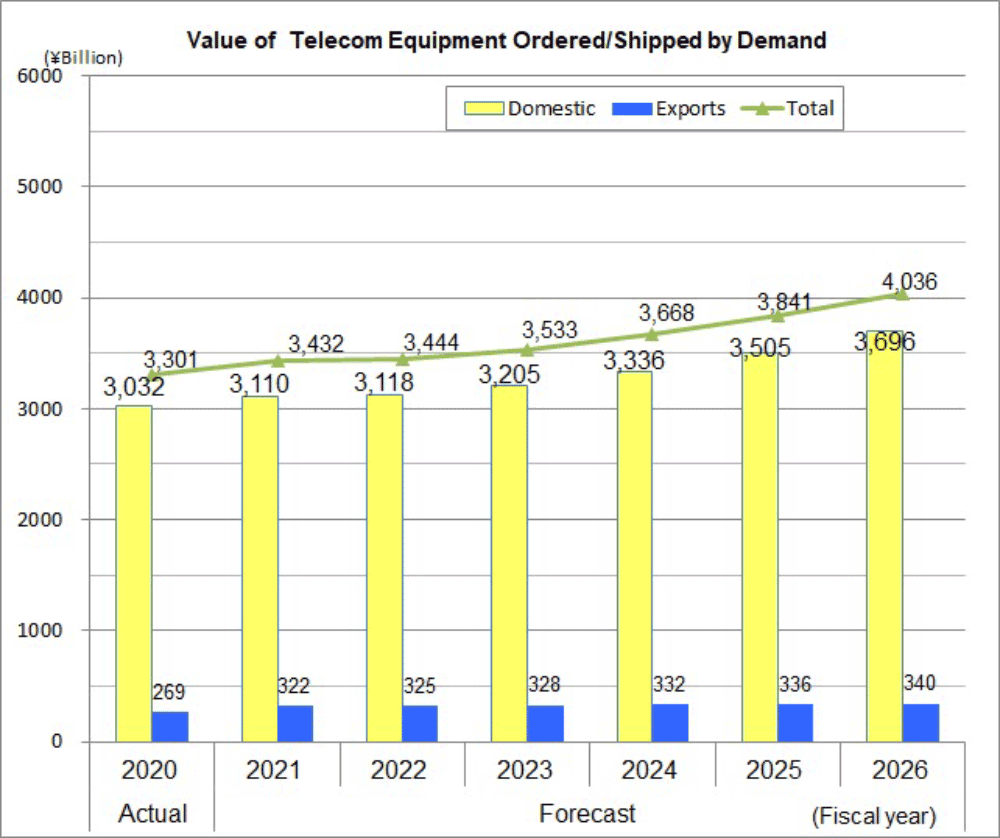
CIAJ statistics for total orders received and shipped in October through December amounted to 332.1 billion yen, representing a decrease of 16.9% year on year. This includes 267.6 billion yen for domestic shipments, which fell by 15.8% year on year, and 64.5 billion yen for exports, which dropped 21.0% year on year.
*Orders received and shipped by CIAJ member companies (domestic manufacturers) = value of domestic production + value of imports produced overseas = domestic shipment + export value
(2) Trends by category
Actual figures by category from October to December are as follows:
Wireline terminal equipment 113.9 billion yen (-11.6% over the same period of the previous year)
Orders received and shipment of intercoms began to recover from the impact of COVID-19, and demand from homes and offices increased. Shipments of telephone sets and office-use cordless handsets decreased due to a shortage of parts supply and labor for production at overseas plants. Orders received and shipment of personal facsimiles (including multifunction printers) and business facsimiles (including multifunction printers) were also stagnant due to parts shortages and logistics disruption, which affected not only the domestic market but also exports. As a result, wireline terminal equipment as a whole decreased year on year.
Mobile terminal equipment 109.0 billion yen (-7.2% over the same period of the previous year)
Mobile phones began to slow down compared to the previous year in the third quarter and decreased year on year, despite the release of new 5G-compatible smartphones and replacement demand reflecting the planned 3G termination. Shipment of other mobile terminal equipment was also sluggish both in Japan and abroad.
Wireline network equipment 49.9 billion yen (-26.7% over the same quarter of the previous year).
Shipment of most models of business-use equipment such as key telephones and PBXs decreased due to the shortage of semiconductors and other parts. Digital transmission equipment and PON/MC decreased in part due to a reactionary fall from the maintenance of optical cable networks across the country, including the GIGA School Program, in the previous year and shipment decreased in overall wired network equipment.
- Wireless network equipment 43.2 billion yen (-37.4% over the same quarter of the previous year).
Among fixed communications equipment, demand for satellite products for government offices and exports increased, but the overall wireless network equipment declined year on year as investment in base station communications equipment for 5G mobile phones has run its course.
- Other network equipment 7.4 billion yen (-18.9% over the same period of the previous year).
Routers and LAN switches declined due to supply shortages that began in the third quarter reflecting the impact of parts shortages.
- Communication equipment parts 8.7 billion yen (+25.1% over the same period of the previous year)
VII. Domestic Production, Imports and Exports for Calendar Year 2021
(1) Domestic market trends for calendar year 2021
The size of the domestic market stood at 3,239.4 billion yen for the period from January through December 2021, up 14.9% from the previous year. Demand for terminal equipment, which had declined due to lowering of consumer willingness to buy reflecting the impact of the COVID-19 pandemic, began to recover in the second half of 2020 and remained strong throughout 2021. Meanwhile, overall communication equipment grew year on year as demand for network equipment increased due in part to the construction of communication infrastructure for commercial 5G services.
(2) Domestic production for calendar year 2021
Domestic production from January to December 2021 stood at 501.7 billion yen, down 2.2% from the previous year. Other mobile terminal equipment, including commercial radio terminals, and wireline network equipment such as digital transmission equipment declined due to a reactionary fall of demand from the significant growth in the previous year.
Terminal equipment also decreased due to stagnant production that resulted from parts shortages.
(3) Exports for calendar year 2021
Exports from January through December 2021 stood at 320.7 billion yen, up 13.6% year on year. Exports increased for the first time in four calendar years as exports of parts grew due to expansion of overseas smartphone production, reflecting a decline in the impact of the COVID-19 pandemic, and further, exports of mobile phones and base stations to the U.S. increased.
(4) Imports for calendar year 2020
Imports for January through December 2021 stood at 3,131.9 billion yen, up 17.5% from the previous year. Imports for calendar year exceeded 3,000 billion yen for the first time as imports of mobile phones, which account for a large proportion of total imports, remained strong during the first half of 2021 and imports of base stations and “other products (transmission equipment, communications equipment, modem, etc.)” in data communications equipment increased further from the previous year, reflecting strong demand related to networks.