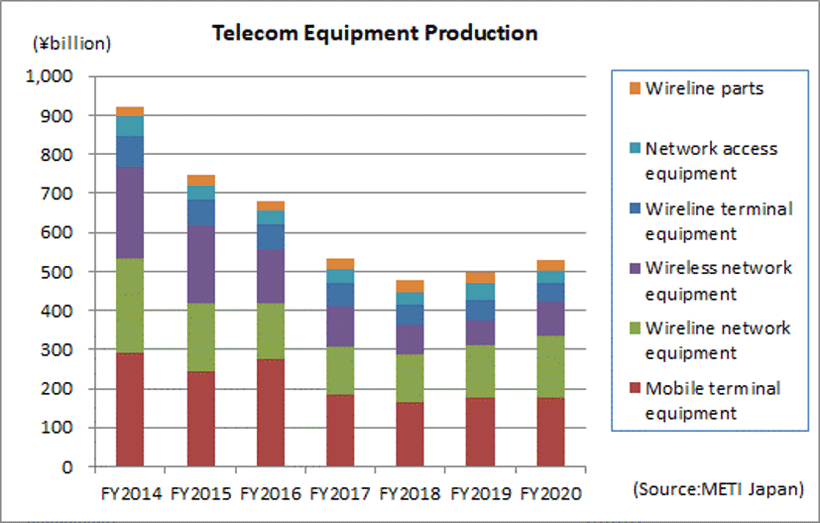
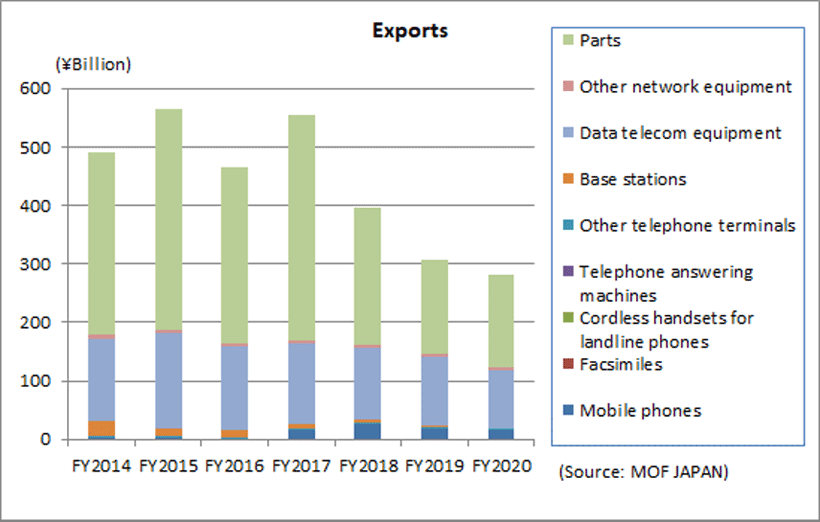
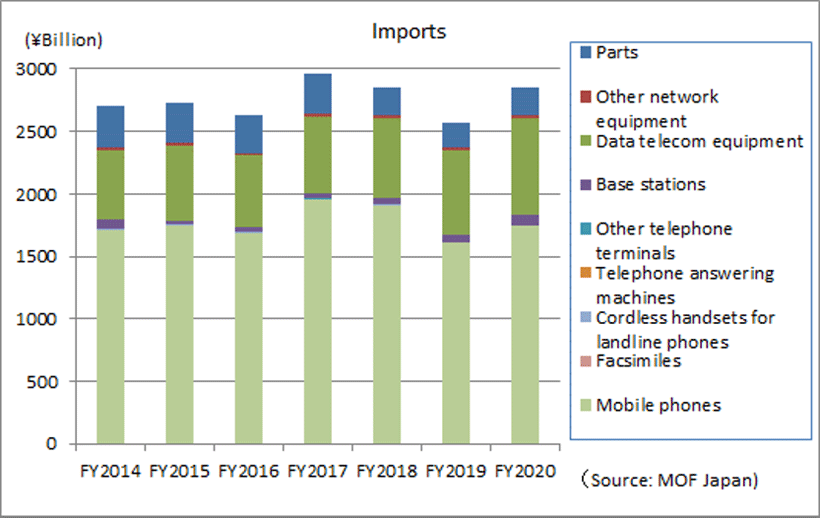
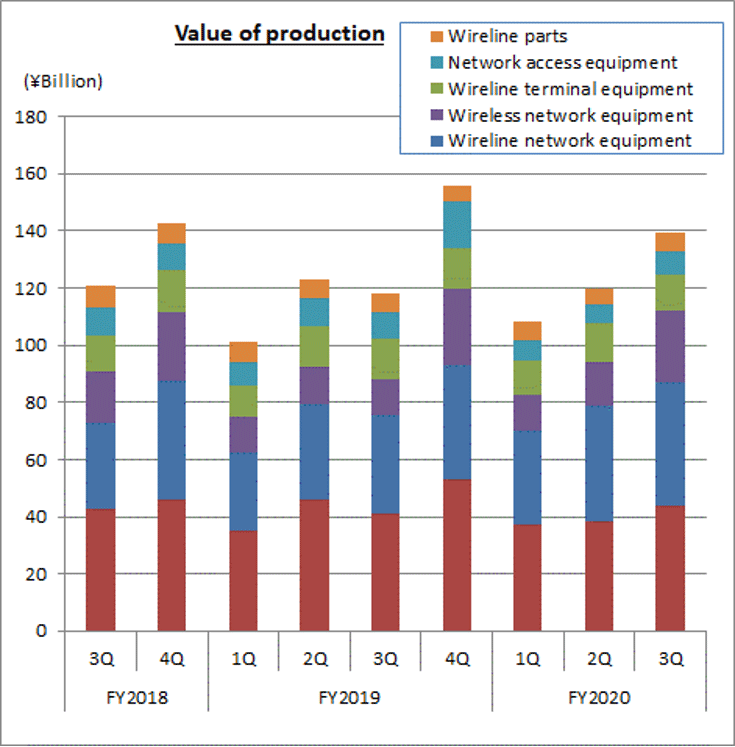
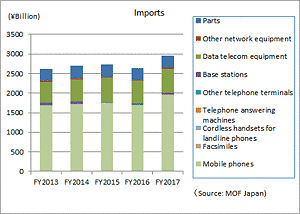
Telecommunication Equipment Production and Trade Figures for the Third Quarter (October-December) of FY2020 – September) – A recovery trend in demand reflecting a reduction of the impact of the COVID-19 pandemic –

I. Summary

In October through December 2020, the Japanese economy was on a recovery trend, continuing to grow significantly following real GDP growth (annual growth rate of 22.7%) in the previous quarter, a reaction to the adverse impact of the COVID-19 pandemic, with an annual real GDP growth rate of 12.7% (first preliminary figures: February 25). However, real GDP has not yet returned to the level before the sharp fall caused by the pandemic. In the 2020 calendar year, the real GDP growth rate was -4.8%, the first negative growth in the 11 years since 2009.

In these circumstances, in October through December, capital expenditure continued to increase in the telecommunication equipment market, in line with the construction of 5G communication infrastructure and the nationwide development of optical cable networks which have been unaffected by the COVID-19 pandemic. Demand for mobile phones, which had declined due to COVID-19, and business-related devices, for which sales activities were weak and capital expenditures were curbed, is recovering.

(1) Domestic Market Trends

The domestic market value (domestic production value – export value + import value, excluding components; imports including products made by overseas manufacturers) amounted to 980.1 billion yen in the October-through-December period, a year-on-year increase of 19.4%. Demand for terminal equipment is increasing and returning to the level of two years ago. The cumulative total market size from April through December was 2,144.5 billion yen, up 5.8% year-on-year.

(2) Domestic Production Trends

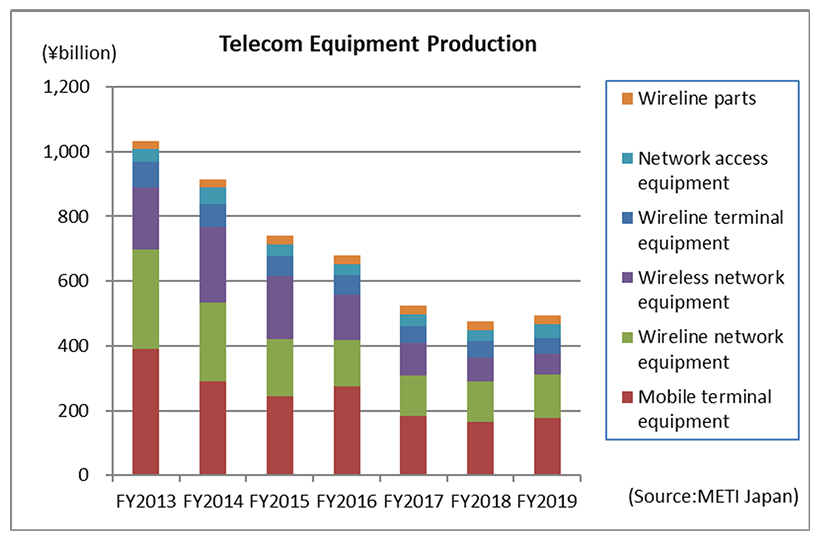
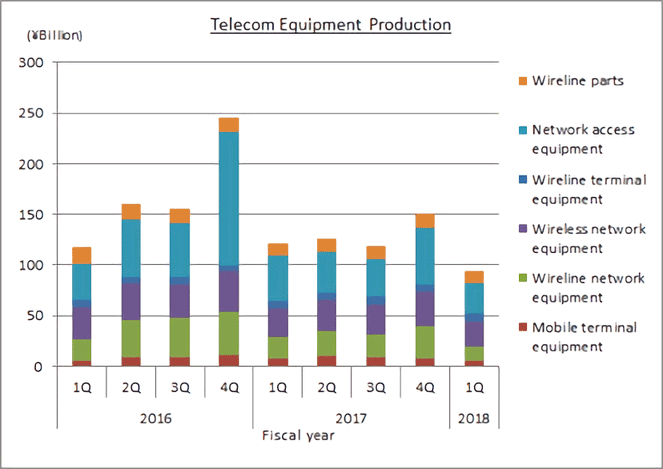
Domestic production totaled 137.3 billion yen in October through December, a year-on-year increase of 17.8%. Domestic production increased for the first time in two quarters, reflecting a recovery in buyers’ motivation to buy mobile phones, which was previously weak, and a significant increase in capital expenditure, including investment in 5G base stations. The cumulative total from April to December stood at 359.7 billion yen, up 5.8% year-on-year.

(3) Export Trends

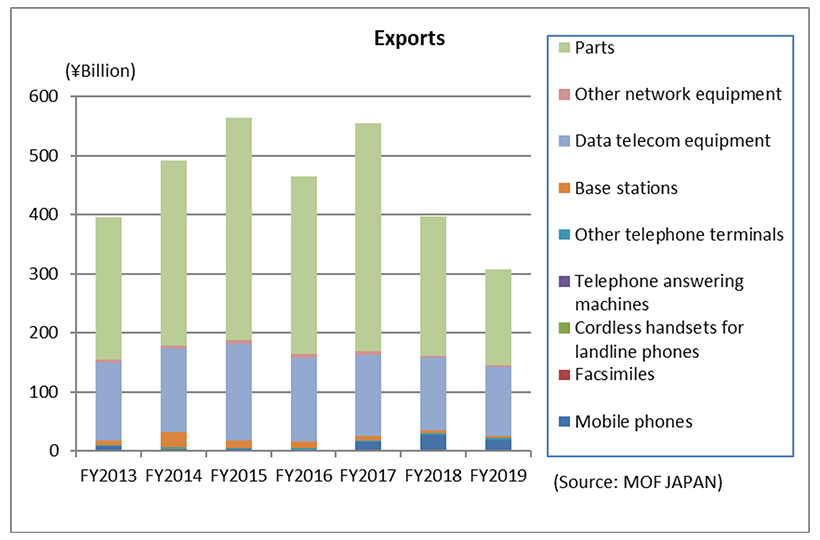
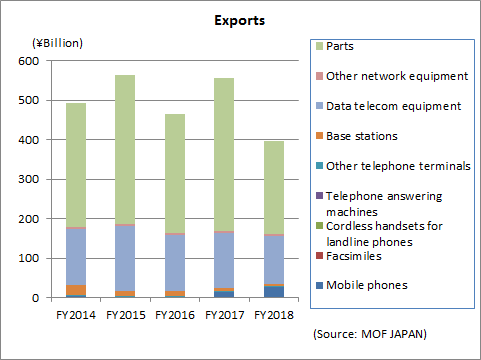
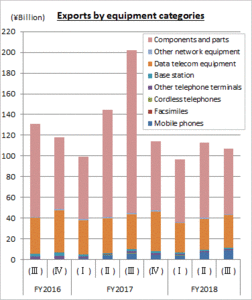
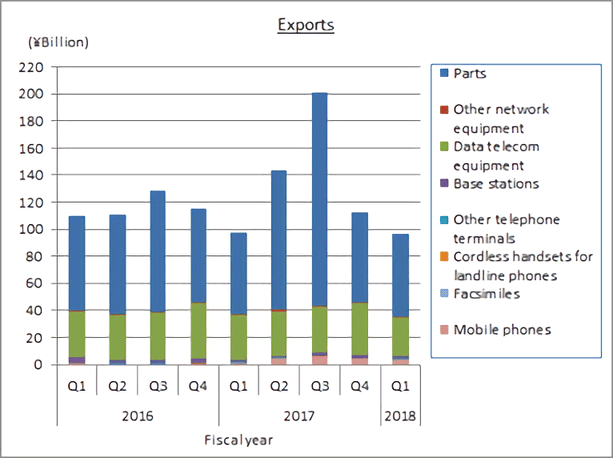
Total exports amounted to 80.3 billion yen for October through December, a slight year-on-year increase of 0.1%. Smartphone production in emerging countries in Asia recovered and exports of components for smartphone production is increasing. As a result, exports increased for the first time in 12 quarters. In total from April to December, the figure dropped by 10.5% year-on-year to 212.5 billion yen, reflecting a decrease in exports of equipment other than components of smartphones due to the continued slowdown in overseas economies.

(4) Import Trends

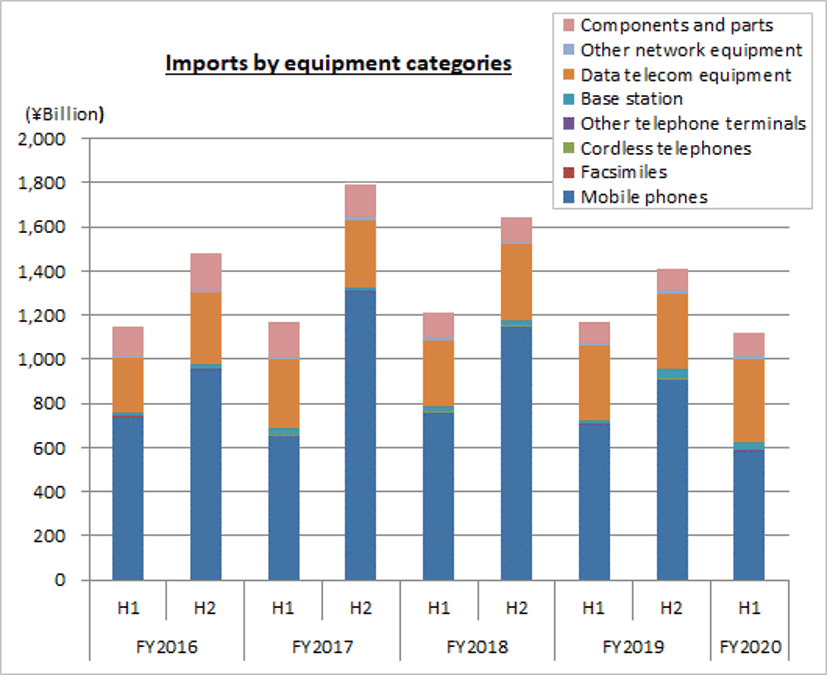
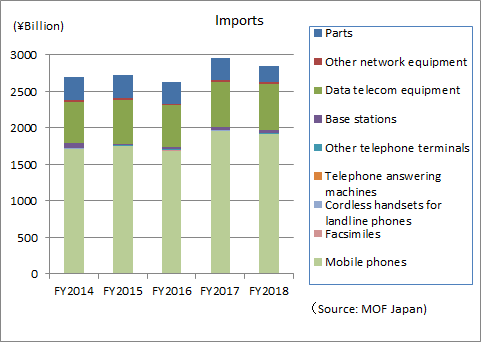
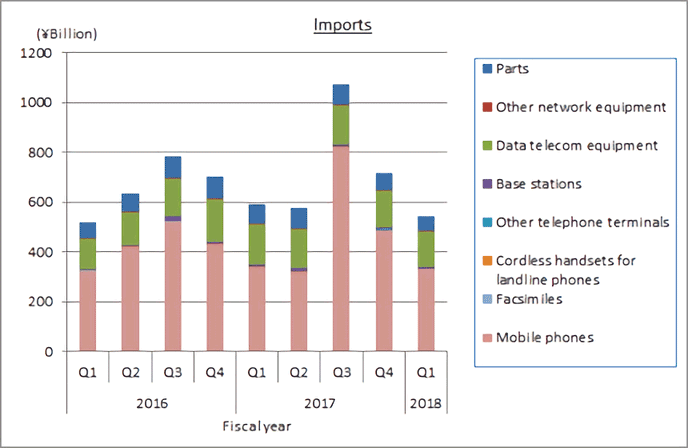
In the October-through-December period, total imports amounted to 939.6 billion yen, a 17.0% increase year on year. Imports increased for the first time in two quarters, reflecting continued strong domestic demand related to networks, including demand for base stations and equipment in the “other (transmission equipment, communications equipment, modem, etc.)” category in data communications equipment and a recovery in demand for mobile phones, which account for a large percentage of the total value of imports. The total from April to December stood at 2,059.8 billion yen, up 4.4% year-on-year.

II. Domestic Market Trends

(Aggregated by CIAJ based on Indices of Industrial Production and Trade Statistics of Japan)

(1) Detailed trends by category

Actual figures by category for October through December are as follows. Both network equipment and terminal equipment grew.

The size of the domestic market (including the value of imports of foreign brands) was calculated from government figures, the Indices of Industrial Production and Trade Statistics of Japan, according to the following formula: Domestic market size = value of domestic production – value of exports + value of imports

  1. Terminal equipment : 693.8 billion yen (+17.2% over the same period of the previous year)

  2. Network equipment : 286.3 billion yen (+25.1% over the same period of the previous year)

III. Domestic Production

(Based on Indices of Industrial Production compiled by the Ministry of Economics, Trade and Industry)

(1) Detailed trends by category

Actual figures by category for October through December are as follows.

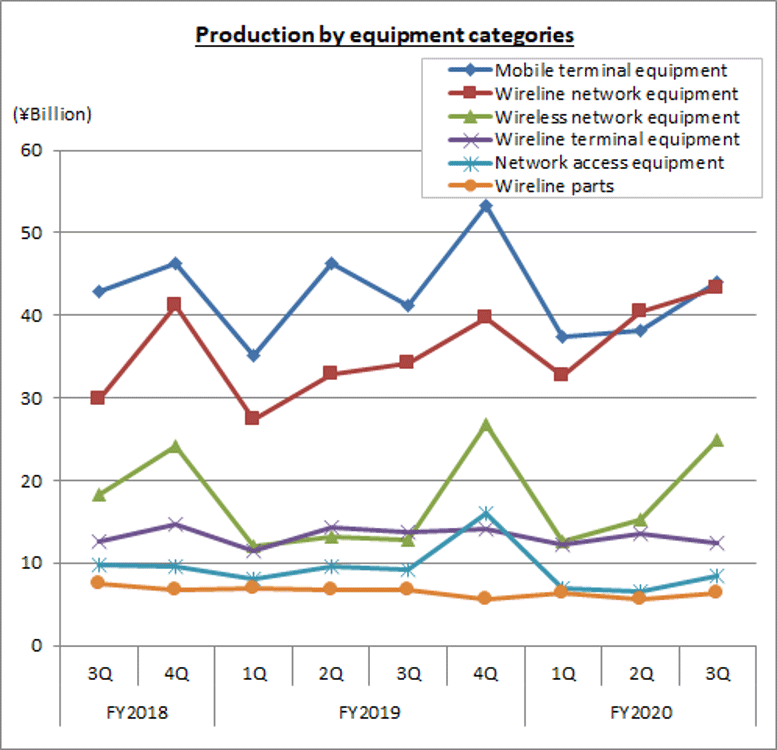
  1. Wireline terminal equipment

    10.5 billion yen (-15.5% over the same quarter of the previous year). Of this, telephone sets were 0.5 billion yen (-11.0% over the same period of the previous year), key telephones 3.2 billion yen (-6.0%), and intercoms 6.8 billion yen (-19.5%). Demand for intercoms for homes and key telephones for office buildings were weak due to the restriction of face-to-face sales and installation work and a decrease in construction starts because of the COVID-19 pandemic. Although production is recovering from the decline caused by COVID-19, domestic production decreased.

  2. Mobile terminal equipment

    44.0 billion yen (+6.7% over the same quarter of the previous year). Of which, mobile phones were 27.8 billion yen (+8.0% over the same quarter of the previous year). Although mobile phones were adversely affected by the COVID-19 pandemic, they are on a recovery trend. Sales of new products, including 5G models, were strong, and domestic production increased.

  3. Wireline network equipment

    43.2 billion yen (+26.1% over the same quarter of the previous year). Of which, central office switching systems was 4.6 billion yen (+62.0% over FY2019), PBXs was 1.0 billion yen (-23.3% over FY2019), digital transmission equipment was 18.3 billion yen (+52.1% over FY2019) and other transmission equipment was 17.1 billion yen (+5.3% over FY2019). In central office switching systems, production of equipment for conversion to IP telephony increased, reflecting the migration of fixed line telephones to IP telephony networks. PBXs are recovering from the decline caused by a decrease in opportunities to use fixed line telephones and a reduction in offices due to the increase of people working from home, but domestic production of PBXs decreased. Domestic production of digital transmission equipment continues to increase significantly due to strong investment in backbone network equipment, in line with the construction of 5G telecommunication infrastructure and the nationwide development of optical cable networks.

  4. Wireless network equipment

    24.9 billion yen (+94.4% over the same quarter of the previous year). This includes 6.9 billion yen (down 5.5% year on year) for fixed telecommunication devices and 18.1 billion yen (up 185.4% year on year) for base station communication equipment. Domestic production of fixed communications equipment rose, reflecting firm production for government offices. Domestic production of base station communications equipment is increasing significantly for the construction of 5G communication infrastructure.

  5. Network access equipment

    8.4 billion yen (-8.7% over the same quarter of the previous year). Demand for routers for telecommunications carriers is firm on the back of an increase in traffic due to teleworking and online meetings. Domestic production of LAN switches decreased year on year due to weak capital expenditure at companies because of the COVID-19 pandemic and a decline in demand, despite a recovery in demand owing to the GIGA School Initiative, primarily because of the extension of installation work.

  6. Wireline parts (relays and repeaters for wired equipment)

    6.3 billion yen (-4.8% over the same quarter of the previous year). The year-on-year decline was reduced due to a recovery in the production of smartphones in emerging countries in Asia.

IV. Exports

(Compiled by CIAJ, based on Ministry of Finance’s “Trade Statistics”)

(1) Detailed trends by category

Actual figures by category from October to December are as follows:

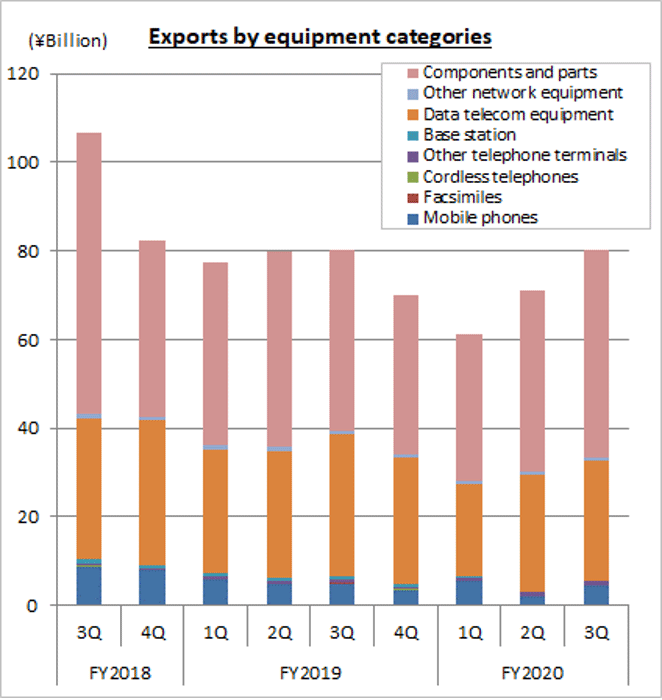
  1. Telephone sets and terminal equipment 5.4 billion yen (-5.3% over the same period of the previous year)

    Of this, mobile phones were 4.3 billion yen (-12.0% over FY2019), cordless handsets for landline phones were 0.06 billion yen (-15.5% over FY2019), and other was 1.0 billion yen (+44.0% over FY2019). Exports of telephone sets and terminal equipment, including video phones, to the United States continued to increase.

  2. Network equipment 28.1 billion yen (-16.5% over the same period of the previous year)

    Of which, base stations were 200 million yen (-74.6% over the same quarter of the previous year), data communication equipment was 27.1 billion yen (-15.2% over the same quarter of the previous year) and other network equipment was 800 million yen (-7.7% over the same quarter of the previous year). Exports were sluggish due to a decrease in almost all equipment caused by a slowdown in overseas economies.

  3. Parts (both wireline and wireless) 46.9 billion yen (+14.5% over the same period of the previous year)

    Smartphone production in emerging countries in Asia recovered and exports of components for smartphone production increased. As a result, exports increased for the first time in 10 quarters.

(2) Detailed trends by region

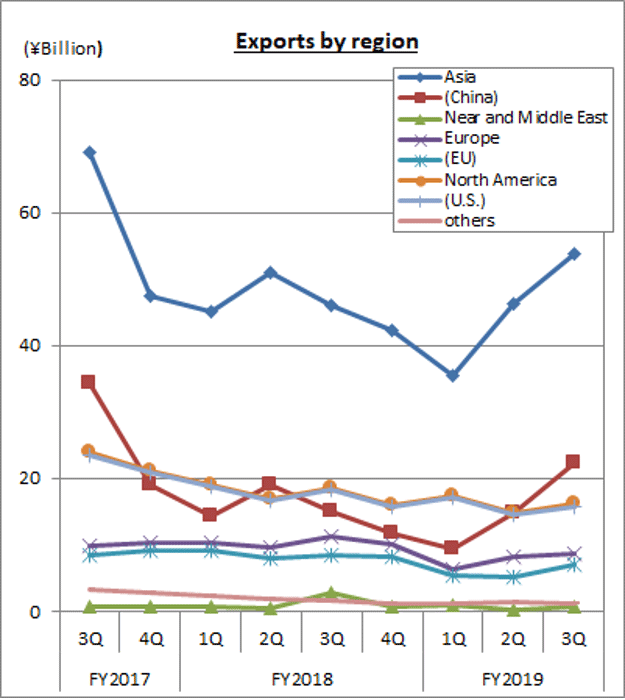
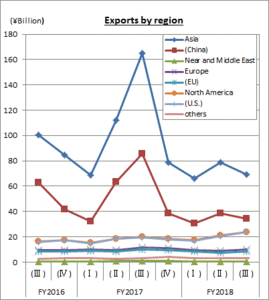
The results by region for the October-through-December period include 53.8 billion yen for Asia (up 16.7% year on year), in which exports to China totaled 22.2 billion yen (down 47.4% year on year). North America was 16.1 billion yen (-13.1% over the same period of the previous year), of which the U.S. was 15.7 billion yen (-13.9% over the same period of the previous year). Europe was 8.6 billion yen (-23.1% over the same quarter of the previous year), of which the EU was 7.1 billion yen (-16.4% over the same quarter of the previous year).
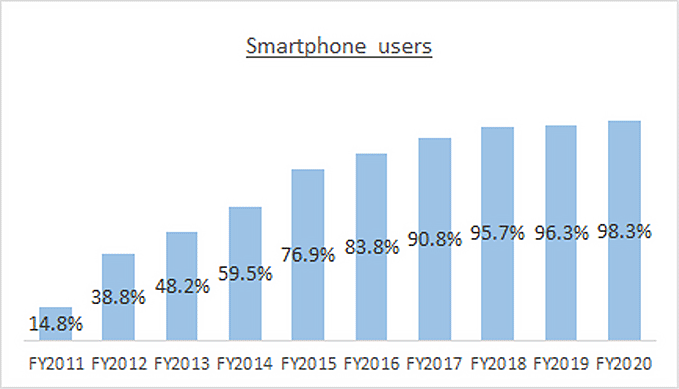
Exports of parts to emerging countries in Asia increased, and exports to Asia and China rose for the first time in 12 quarters. In addition, exports to the United States and Europe, where there is concern about the spread of the COVID-19 coronavirus accelerating again, are declining.

(3) Comparison and breakdown by region

First:Asia66.9% (+9.5% over the same period of the previous year)
Second:North America20.0% (-3.1% over the same period of the previous year)
Third:Europe10.7% (-3.2% over the same period of the previous year)
Other regions:2.3% (-3.2% over the same period of the previous year)

V. Imports

(Compiled by CIAJ, based on Ministry of Finance’s “Trade Statistics”)

(1) Detailed trends by category

Actual figures by category from October to December are as follows:

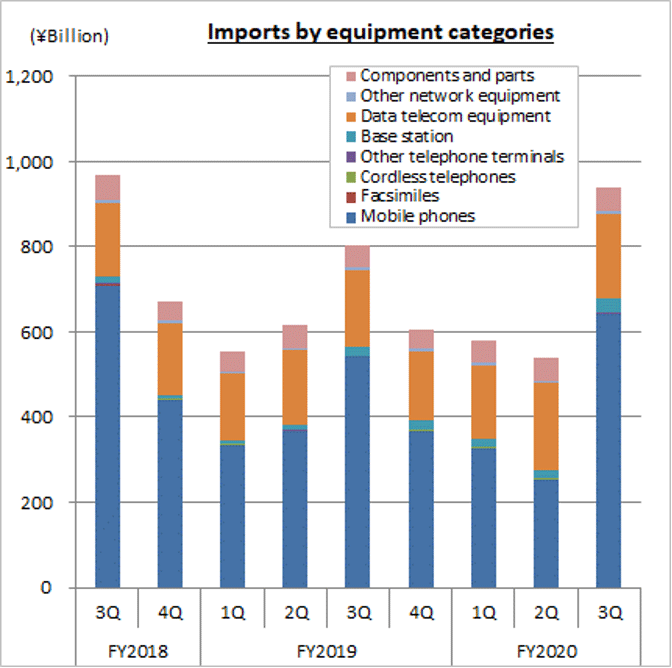
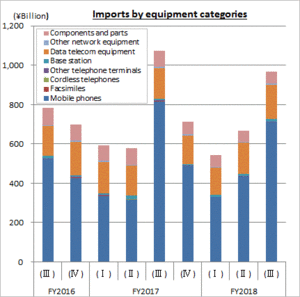
  1. Telephone sets and terminal equipment 644.8 billion yen (+18.5% over the same period of the previous year)

    Of which, mobile phones were 641.7 billion yen (+18.6% over the same quarter of the previous year), cordless handsets for landline phones were 1.4 billion yen (+19.8% over the same quarter of the previous year) and other was 1.6 billion yen (+0.5% over the same quarter of the previous year). Regarding mobile phones, imports of smartphones increased, reflecting firm sales of 5G models, including new products from overseas manufacturers.

  2. Network equipment 237.8 billion yen (+15.3% over the same period of the previous year)

    This includes 32.4 billion yen for base stations (up 69.3% year on year), 198.9 billion yen for data communication equipment (up 9.3% year on year), and 6.6 billion yen for other network-related apparatuses (up 29.9% year on year). Imports of “other products (transmission equipment, communications equipment, modems, etc.)” in data communication equipment continued to increase due to growth in demand for network equipment.
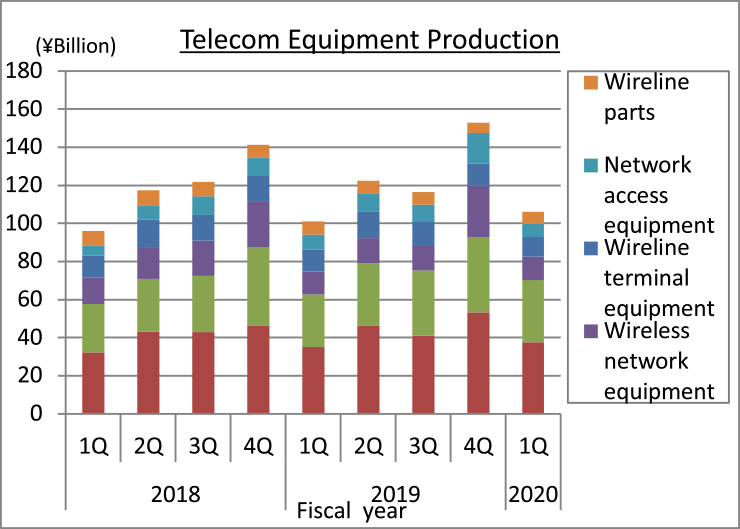
  3. Parts (both wireline and wireless) 57.0 billion yen (+8.2% over the same period of the previous year)

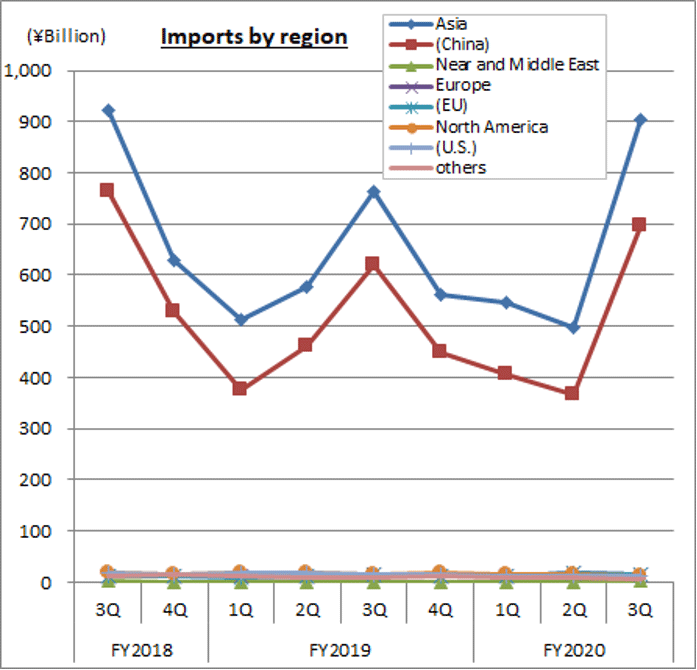
(2) Detailed trends by region

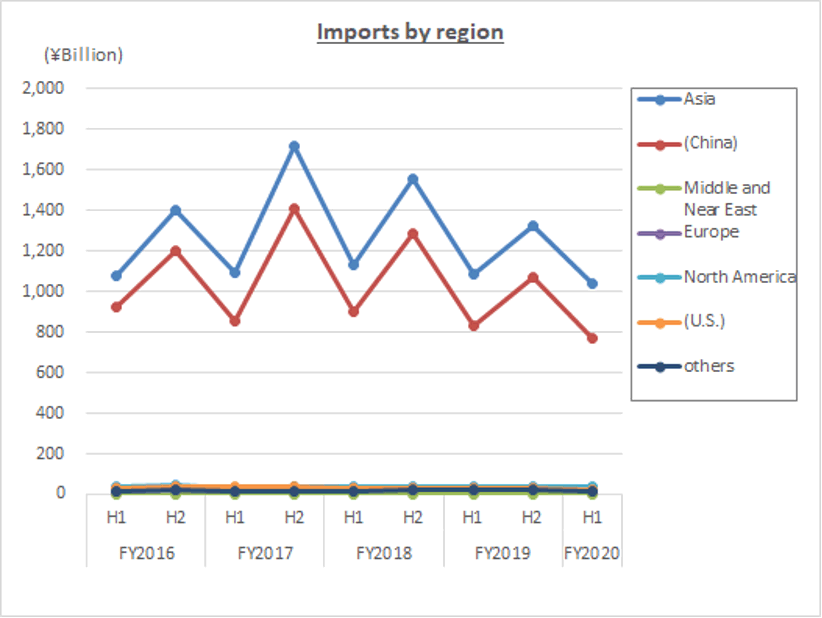
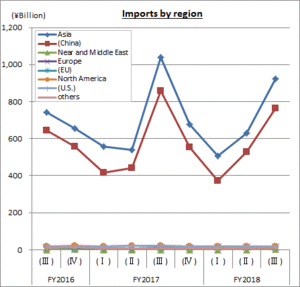
A breakdown of results for October through December by region shows that Asia was 902.6 billion yen (+18.3% over the same quarter of the previous year), of which China was 697.2 billion yen (+12.7% over the same quarter of the previous year). North America was 12.3 billion yen (-22.0% over the same quarter of the previous year), of which the U.S. accounted for 10.9 billion yen (-24.9% over the same quarter of the previous year). Europe was 16.3 billion yen (+13.3% over the same quarter of the previous year), of which the EU was 16.1 billion yen (+13.8% over the same quarter of the previous year).

(3) Comparison and breakdown by region

First:Asia96.1% (+1.1% over the same period of the previous year)
Second:North America1.3% (-0.7% over the same period of the previous year)
Third:Europe1.7% (-0.1% over the same period of the previous year)
Other regions:0.9% (-0.4% over the same period of the previous year)

VI. Trends in Orders Received and Shipped

(From CIAJ statistics)

(1) Results in October through December, 2020

CIAJ statistics for total orders received and shipped in October through December amounted to 399.4 billion yen representing an increase of 10.2% year on year. This includes 317.7 billion yen for domestic shipments which rose by 11.3% year on year, and 81.7 billion yen for exports, which climbed 6.2% year on year. Orders received and shipped from April through December totaled 1,060.0 billion yen, down 4.9% year-on-year, comprising domestic shipments of 865.2 billion yen, down 2.1% year-on-year and exports of 194.8 billion yen, down 15.7% year-on-year.

*CIAJ statistics for total orders received and shipped = orders received and shipped by CIAJ member companies in Japan
(=value of shipments for the domestic market (domestic production + foreign production) + value of exports = value of domestic production + value of imports of products produced abroad)

(2) Trends by category

Actual figures by category from October to December are as follows:

  1. Wireline terminal equipment 128.8 billion yen (-0.3% over the same period of the previous year)

    Overall orders for wireline terminal equipment received and shipped were roughly on par with the previous year, reflecting an increase in demand for, primarily exports of, personal fax machines (including multifunction personal fax machines) due to the expansion of demand associated with telework due to the COVID-19 pandemic, a decrease in domestic demand for cordless handsets for landline phones and intercoms and falls in domestic demand for and exports of business fax machines (including multifunction business fax machines).

  2. Mobile terminal equipment 117.5 billion yen (-7.5% over the same period of the previous year)

    Demand for mobile phones was recovering but fell from the level of the previous year. As for other mobile terminal equipment, commercial radio terminals for government offices and exports, among other products, were firm.

  3. Wireline network equipment 68.0 billion yen (+37.3% over the same period of the previous year)

    Overall orders for wireline network equipment rose year on year, reflecting a recovery in business-related devices such as key telephones and private branch exchanges from the decline caused by the COVID-19 pandemic and the continued strong domestic demand for digital transmission equipment.

  4. Wireless network equipment 69.1 billion yen (+73.3% over the same period of the previous year)

    Overall orders for wireless network equipment increased significantly year on year due to an increase in demand for base station communications equipment used for mobile phones ahead of the commercialization of 5G services.

  5. Other network equipment 9.1 billion yen (-8.3% over the same period of the previous year)

    Despite an increase in demand for routers, demand for LAN switches decreased significantly due to sluggish private capital expenditures for them. As a result, orders for other network equipment as a whole decreased year on year.

  6. Communication equipment parts 6.9 billion yen (+3.3% over the same period of the previous year)

VII. Domestic Production, Imports and Exports for Calendar Year 2020

(1) Domestic market trends for calendar year 2020

The size of the domestic market stood at 2,817.2 billion yen for the period from January through December 2020, up 2.6% from the previous year. Demand for terminal equipment declined further due to reluctance to buy mobile phones around announcements of new rate plans in 2019 and a fall in buyers’ motivation to buy due to the COVID-19 pandemic in 2020. Meanwhile, demand for network equipment increased as capital expenditure for the construction of 5G communication infrastructure and the nationwide development of optical cable networks was not affected by the COVID-19 pandemic. As a result, the domestic market overall increased from the previous year.

(2) Domestic production for calendar year 2020

Domestic production from January to December 2020 stood at 512.7 billion yen, up 6.5% from the previous year. The year-on-year increase in domestic production was attributable to strong demand for network equipment.

(3) Exports for calendar year 2020

Exports from January through December 2020 stood at 232.8 billion yen, down 11.8% year on year. In 2019, smartphone production shrank in emerging countries in Asia due to trade friction and sluggish overseas economies, and exports of components of smartphones fell significantly. In 2020, demand overseas was weak due to the COVID-19 pandemic. As a result, exports declined from the previous year in almost all categories.

(4) Imports for calendar year 2020

Imports for January through December 2020 stood at 2,664.8 billion yen, up 0.7% from the previous year. While imports of mobile phones, which account for a large proportion of total imports, dropped from the preceding year due to stagnating domestic demand, imports of base stations and “other products (transmission equipment, communications equipment, modem, etc.)” in data communications equipment increased from the previous year, reflecting strong demand related to networks.

CIAJ Releases "FY2020 – FY2025 Mid-Term Demand Forecast for Telecommunication Equipment" COVID-19 pandemic will continue to weigh on demand, but New 5G service-compatible devices and base stations expected to stimulate recovery in FY2023

The Communications and Information network Association of Japan (CIAJ), a general incorporated association, released its “Mid-Term Demand Forecast for Telecommunication Equipment,” covering FY2020 through FY2025. The report forecasts demand and analyzes technology service trends for communication infrastructure equipment to accommodate explosive network traffic growth and devices compatible with new services which are both associated with the launch of commercial 5th generation mobile communication system (5G) services

I. Outline

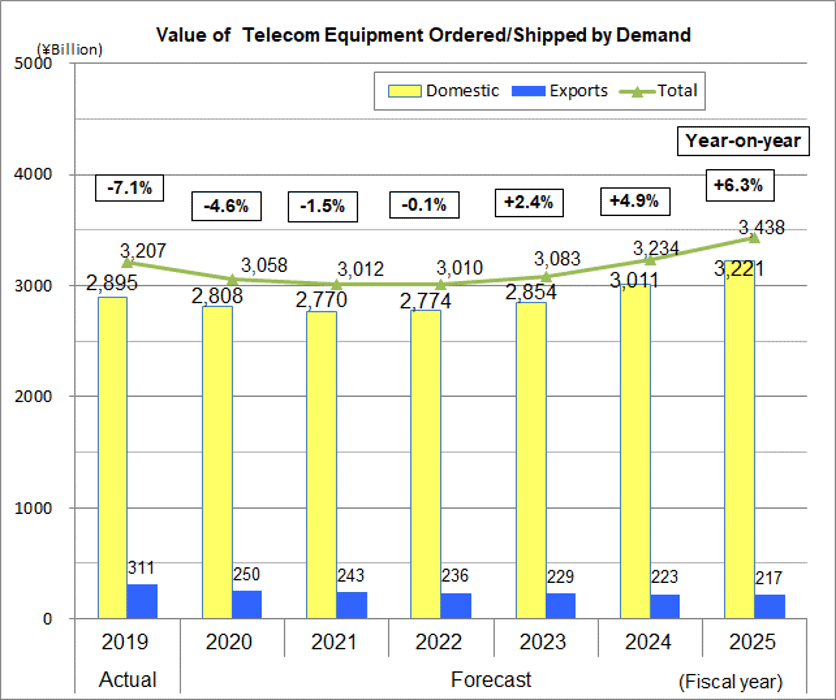
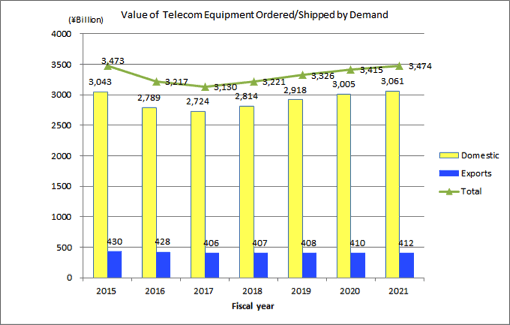
The Japanese economy was experiencing a gradual recovery in FY2019, but reversed gear at the end of the fiscal year with the outbreak of COVID-19. Consumer spending shrank with voluntary lockdowns before it had fully recovered from the rise in consumption tax, capital investment in facilities shrank as construction and equipment manufacturing declined in the latter half of the fiscal year and businesses delayed investments and exports declined as the global economy slowed. The telecom equipment market was helped by network facility investments to build domestic 5G infrastructure and nation-wide optic cable networks, but the large bulk of demand is dependent on mobile devices. Although upgrades from feature-phones continue, the spread of COVID-19 has dampened purchasing appetites and withholding upgrades until new 5G devices appear on the market have led to the decline in demand. In addition, the slowdown in the global economy led to a decline in exports for almost all categories, resulting in a forecast for FY2020 of 3.207 trillion yen (-7.1% year-over-year growth).

The Japanese economic growth in FY2020 is likely to slow significantly with consumer spending deterred by apprehension towards possible restrictions placed on economic activity to slow the resurgence of infections and continuing decline in capital expenditure in facilities. Private sector thinktanks project real GDP to be -5.6% for FY2020 as of November. Demand for telecom infrastructure is on the rise, but consumer and business equipment demand has been impacted by COVID-19, which has forced cutbacks in business activities and lowered demand. Thus, the total demand for telecom equipment in FY2020 is forecast at 3.584 trillion yen (-4.6% year-over-year growth).

The ICT industry from FY2021 onwards will contribute to revitalizing the Japanese economy and overcoming social challenges as communication infrastructure continues to be built and strengthened under COVID-19 influences that promote new workstyles, like working from home/remote work and on-line learning, while developing and advancing new technologies and products – including those based on 5G and AI, leading to digital innovation in society. The total market value is expected at 3.438 trillion yen in FY2025, or an increase of 7.2% over the FY2019 figure.

II. 2020 Forecast

The total telecommunication equipment market figure for FY2020 is forecast at approximately 3.584 trillion yen (-4.6% year-over-year growth), with the domestic market accounting for 2.808 trillion yen (-3.0% year-over-year growth), and exports accounting for 250.4 billion yen (-19.6% year-over-year growth).

Major Equipment Categories Expected to Increase Over FY2019 (in descending order)
FY2020
(expected)
(billion yen)
Increase over
FY2019
(billion yen)
Growth rate
Digital transmission equipment172.812.67.9%
Fixed communication equipment168.48.75.4%
Optical access equipment25.32.310.0%
LAN switches178.62.31.3%
Routers103.100.0%

(1) Consumer equipment total: 1.667 trillion yen (-5.1% over FY2019)

  • Revision of the Telecommunication Business Act in Oct. 2019 capped device discounts at 20,000 yen, resulting in higher price tags for the consumer. In addition, the COVID-19 pandemic reduced purchasing opportunities at brick-and-mortar retailers, replacement cycle of mobile terminals continued to become longer and along with the “wait-and-see” psychology among consumers until new pricing plans and 5G device line-ups are announced all led to decreasing demand.
  • Steady demand among older adults for cordless phones and personal facsimiles (including multi-functioning facsimiles) with value-added features, such as easier to see large LCDs, voice communication capacity during black-outs or use of databases to block unwanted telemarketing calls or calls from scam artists will not be enough to reverse the overall downward trend.

(2) Enterprise equipment total: 399.4 billion yen (-14.2% over FY2019)

  • Replacements are central to demand for key telephones, PBXs and office-use cordless phones and was already declining as workstyle innovation accelerated by the COVID-19 pandemic decreased use of fixed telephones and businesses decide to minimize office space with more employees working from home.
  • Overseas demand takes up a large share for office-use facsimiles (including multi-functioning facsimiles) and with the negative impact of COVID-19 on overseas economies, exports are shrinking dramatically.

(3) Infrastructure equipment total: 525.8 billion yen (+4.1% over FY2019)

  • Demand for digital transmission equipment will continue to grow with the realization of nation-wide backbone networks that are 5G-compatible and built on optic cable networks. However, base station demand is expected to remain flat.
  • Private sector capital investment in facilities is on the decline, but demand for fixed communication equipment serving as the backbone of disaster/emergency systems is projected to continue to grow.

(4) Internet equipment total: 307.0 billion yen (+1.5% over FY2019)

  • The COVID-19 pandemic has translated into an increase in network traffic from such phenomena as more people working from home and doing business via on-line meetings, which in turn is expected to drive healthy demand among telecom carriers and government agencies for routers, LAN switches and optical access equipment.

(5) Equipment/parts categories not included above: 159.5 billion yen (-10.0% over FY2019)

III. Midterm Projection

The FY2025 total figure is projected at 3.438 trillion yen (+7.2% growth over FY2019), with the domestic market accounting for 3.221 trillion yen (+11.3% growth over FY2019) and exports accounting for 216.7 billion yen (-30.4% growth over FY2019).

Major Equipment Categories Expected to Increase Over FY2019 (in descending order)
FY2025
(expected)
(billion yen)
Increase over
FY2019
(billion yen)
Growth rate
Mobile communication terminals
(public network use)
1997.4280.016.3%
Base station equipment250.866.335.9%
Fixed communications equipment174.815.09.4%
LAN switches190.514.28.1%
Digital transmission equipment170.510.26.4%
Optical access equipment27.84.820.9%

(1) Consumer equipment total 2.021 trillion yen (+15.1% over FY2019)

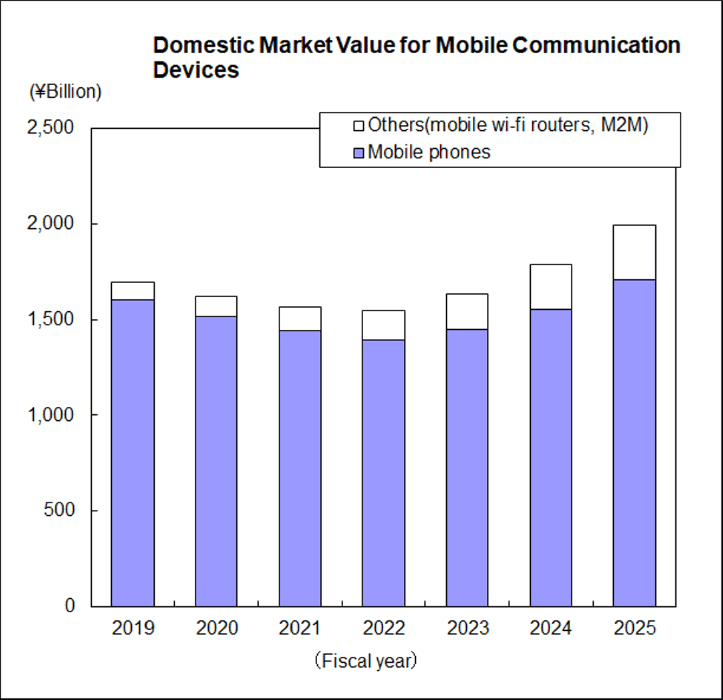
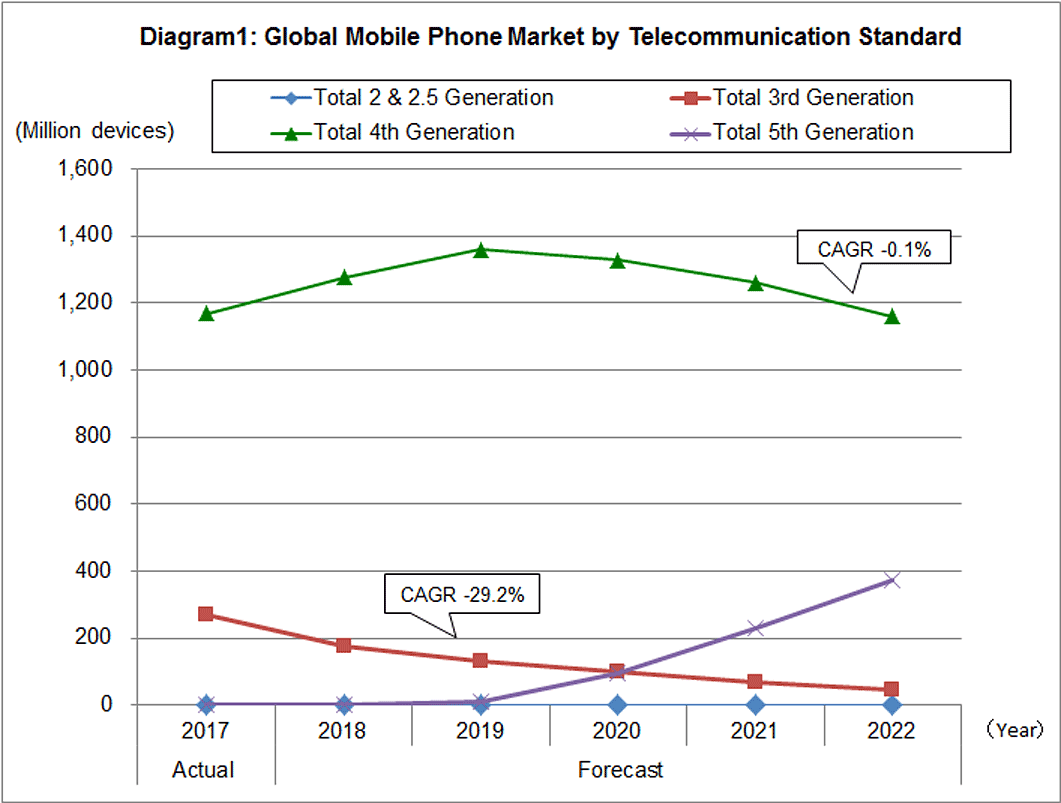
  • Domestic demand for mobile communication terminals is forecast to show significant growth with new 5G service-compatible devices coming on the market and expansion of IoT leading to greater use of M2M (Machine to Machine) modules.
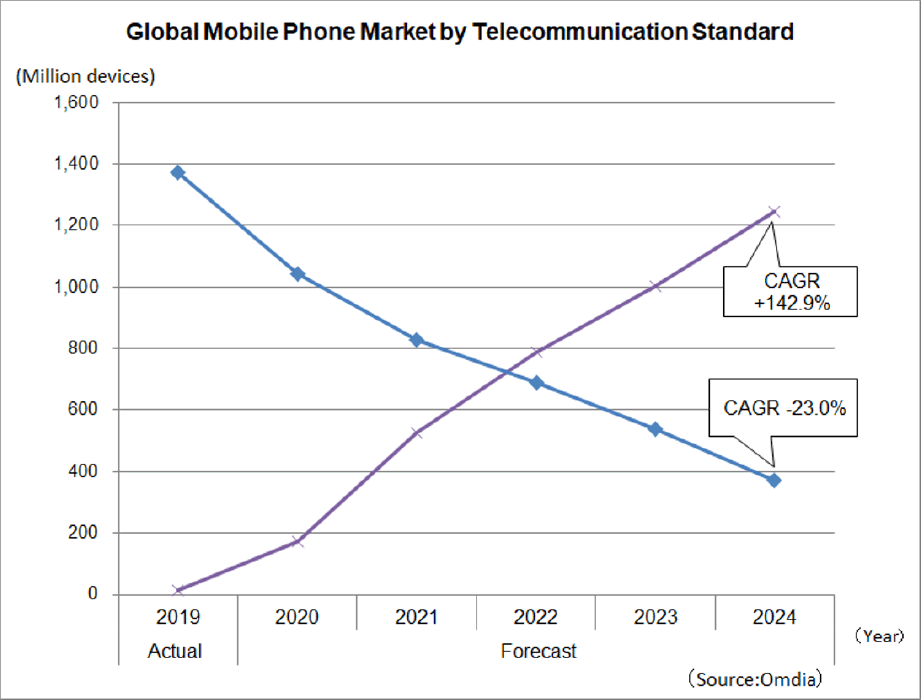
  • The global mobile phone market (includes smartphones) sales revenue in FY2024 is projected at 421.3 billion U.S. dollars (CAGR +3.3%) with the launch of commercial 5G services. Unit sales of smartphones by communication format will decrease in FY2020 with COVID-19, but is forecast to rebound in FY2021 onwards as upgrade demand for 5G handsets grows.
  • Although value-added features catering to the needs of older adults will sustain steady demand for certain categories, overall demand for cordless phones and personal facsimiles (including multi-functioning facsimiles) is forecast to continue declining with fewer use cases and more consumers opting not to own devices in this category.

(2) Enterprise equipment total: 337.1 billion yen (-27.6% over FY2019)

  • Key telephones, PBXs and office-use cordless phones are forecast to decline as the COVID-19 pandemic fast forwards workstyle innovations, with large corporations leading the way in rebuilding voice communication platforms to create environments to communicate from anywhere, connecting to the cloud and taking advantage of smartphone intra-office apps – all fueling the shift away from land line telephones.
  • The domestic market for office-use facsimiles (including multi-functioning facsimiles) will continue to decline with less use as shifts to other communication channels such as e-mail result in longer replacement cycles as well as workstyle innovations require less intra-office paperwork and thus, smaller office spaces.

(3) Infrastructure equipment total: 596.3 billion yen (+18.0% over FY2019)

  • The surge for network digital transmission equipment and terrestrial fixed communication devices to accommodate the spike in data traffic from the COVID-19 pandemic (i.e., telework) is expected to reach the end of its demand cycle, while services which take advantage of 5G features – high speed & high capacity, simultaneous high-density connections with low latency – will lead to a significant investment growth in base stations from FY2022 onwards.
  • Public sector demand for satellite fixed communication equipment will remain steady with planned satellite launches.

(4) Internet equipment total: 320.5 billion yen (+6.0% over FY2019)

  • Demand for routers is forecast to slightly decrease as the market shrinks. Positive factors include investments in laying down 5G networks, further progress towards digitalization and workstyle transformation fueled by COVID-19 as well as upgrading and expanding facilities in order to accommodate faster speeds and advanced security features. However, these will be outweighed by negative factors, including lower unit prices from fierce price competition, streamlining of equipment and virtualization making use of general-purpose servers.
  • The demand for LAN switches is forecast to increase in value as the embracing of IoT/M2M technologies will result in massive increases in the number of devices connected to the network, meaning a surge in network traffic and investments in carrier facilities and data centers. Commercial 5G services will also translate into additional facilities and replacement demand.
  • Increased use of high-speed services to facilitate growing demand for data-heavy contents, such as video services, growing popularity of smartphone video apps leading to mobile data offloading as well as replacement of outdated equipment are expected to increase the market value for optical access equipment.

(5) Equipment/parts categories not included above: 162.9 billion yen (-8.1% over FY2019)

IV. Trends in the Info-Communication Industry Market

(1) Trends in 5G and local 5G

  • Government authorities are approving 4G frequency bandwidth to be diverted to 5G so that 4G base stations can be used to expand 5G coverage and telecom carriers are implementing open network technologies for base stations (O-RAN Alliance).

(2) Latest IOWN trends

  • The Innovative Optical and Wireless Network (IOWN) was announced as a networks and information processing infrastructure including terminals that can provide high speed/large capacity communications utilizing innovative technology focused on optics as well as tremendous computational resources to exceed the limits of existing infrastructure. The specs will be finalized in 2024 and aim for realization in 2030.
  • IOWN is basically composed of 3 technological areas: “all-photonics network,” “digital twin computing,” and “cognitive foundation.”

(3) Use of ICT in the post COVID-19 era

  • The COVID-19 pandemic has fundamentally changed peoples’ work and lifestyles. Avoiding closed spaces, crowded places, and close-contact settings with others is essential to controlling the spread of the virus. Active use of ICT has been promoted in “work & lifestyles,” “industry and enterprises,” and “governments.”

[Forecasting methodology]

Domestic market forecasts are based on statistics compiled by CIAJ and interviews with CIAJ members, with the cooperation of InfoCom Research, Incorporated, for areas not covered by CIAJ.

Global ICT market forecasts and demand trends refer to and utilize data and analysis provided by a global research company Omdia with the cooperation of InfoCom Research, Incorporated.

Telecommunication Equipment Production and Trade Figures For the First Half of FY2020 (April – September) – Sluggish demand of mobile phones and business devices mainly due to the COVID-19 pandemic despite continued strong demand of telecommunication infrastructure and network equipment –

The Communications and Information network Association of Japan (CIAJ) announces the telecommunication equipment production and trade figures for April through September, 2020 as follows.

I. Summary

The Japanese economy grew significantly in reaction to the considerable decrease due to the COVID-19 pandemic, with an annual GDP growth rate of 22.9% (second preliminary figures for July to September: December 8) in April through September 2020. However, it has not yet returned to the level before the spread of the COVID-19, and there is movement toward recovery amid this severe environment where we are striving to balance preventing the spread of COVID-19 and economic activities.

Under these circumstances, demand for network capital expenditure continues to increase in the telecommunication equipment market in line with the construction of 5G communication infrastructure and the nationwide development of optical cable networks. Yet, due to curtailed business activities and sluggish demand due to the impact of the COVID-19 pandemic, there was a decline in demand for consumer-related devices such as mobile phones and business-related devices, which account for a large proportion of the demand.

(1) Domestic Market Trends

The domestic market value (domestic production value – export value + import value, excluding components) amounted to 1,164.4 billion yen in the April through September period, a year-on-year decrease of 3.5%.  The decrease was caused by a fall in total imports.

(2) Domestic Production Trends

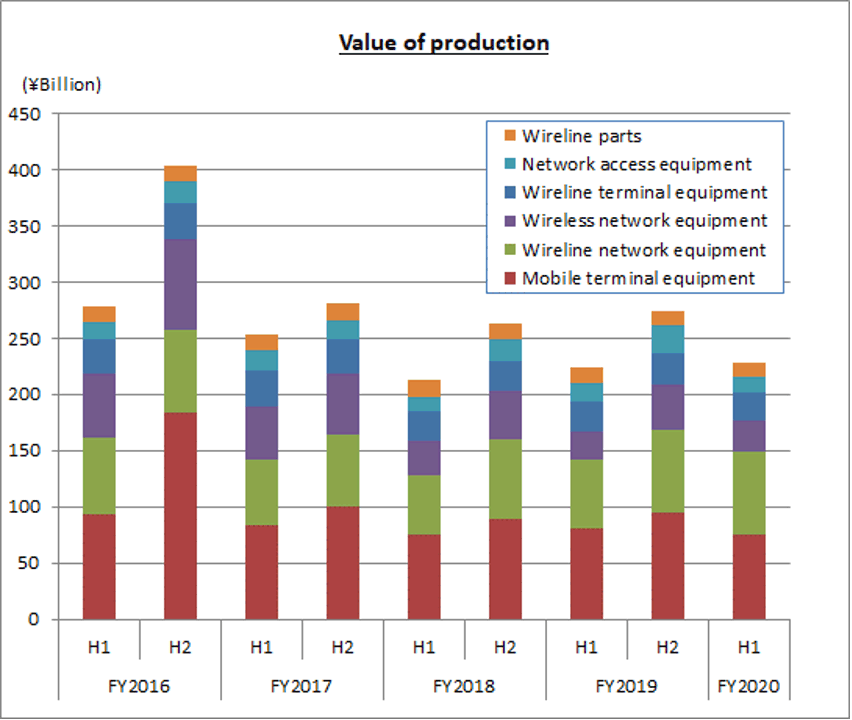
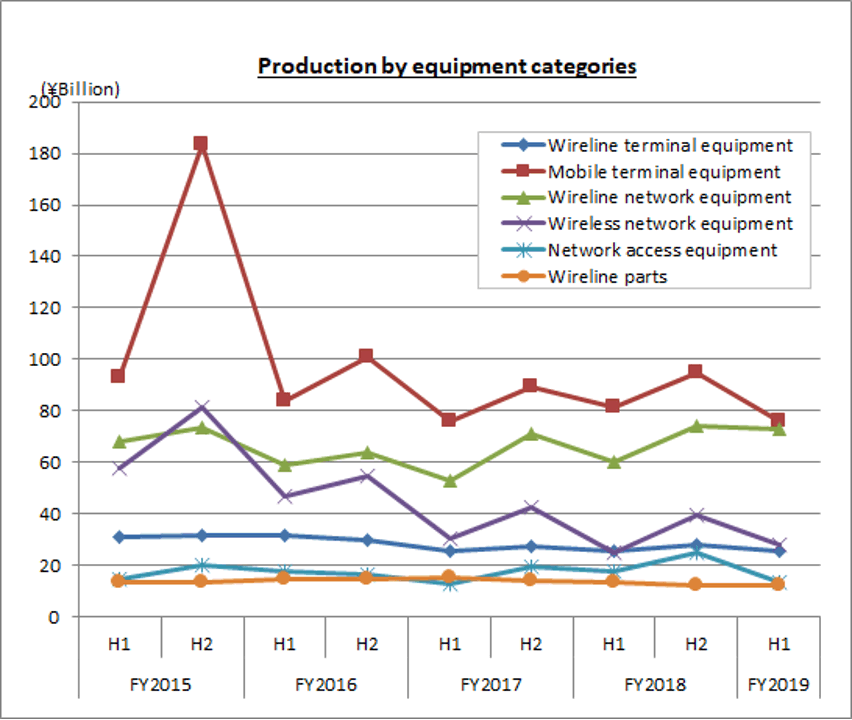
Domestic production totaled 222.3 billion yen in April through September, a year-on-year decrease of 0.5%. Domestic production decreased for the first time in three half-year periods since the second half of fiscal 2018, as a result of a fall in the domestic production of terminal devices such as mobile phones amid the COVID-19 pandemic.

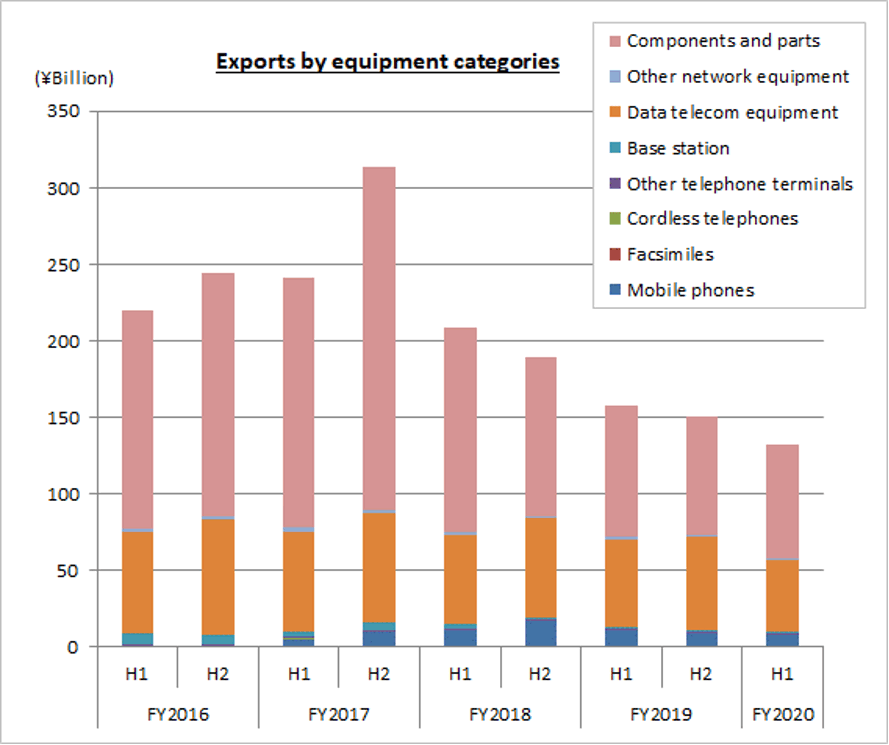
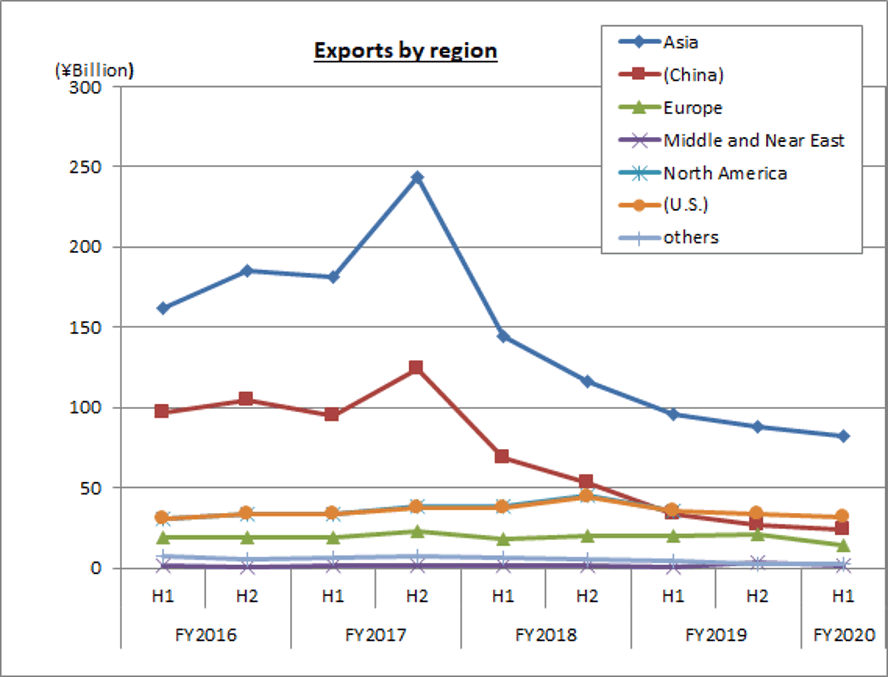
(3) Export Trends

Total exports amounted to 132.1 billion yen for April through September, which was a year-on-year fall of 16.0% and a continued decline. Smartphone shipments in emerging countries in Asia peaked and exports of components for smartphone production decreased. Also, overseas economies slowed due to the COVID-19 pandemic. As a result, exports have decreased in five consecutive half-year periods.

(4) Import Trends

In the April through September period, total imports amounted to 1,120.2 billion yen, a 4.3% decrease year on year. While domestic demand related to networks remains strong, total imports have decreased for four consecutive half-year periods, reflecting a fall in mobile phones, which account for a large share of total imports, partly due to restrained purchasing.

II. Domestic Market Trends

(Aggregated by CIAJ based on Indices of Industrial Production and Trade Statistics of Japan)

(1) Detailed trends by category

Actual figures by category for FY2020 first half (H1) are as follows

The size of the domestic market (including the value of imports of foreign brands) was calculated from government figures, the Indices of Industrial Production and Trade Statistics of Japan, according to the following formula: Domestic market size = value of domestic production – value of exports + value of imports.

  1. Terminal equipment : 674.3 billion yen (-15.8% over the same period of the previous year)

  2. Network equipment : 490.1 billion yen (+20.7% over the same period of the previous year)

III. Domestic Production

(Aggregated by CIAJ based on Indices of Industrial Production compiled by the Ministry of Economics, Trade and Industry)

(1) Detailed trends by categories

Actual figures by category for FY2020 first half (H1) are as follows:

  1. Wireline terminal equipment

    20.3 billion yen (-18.9% over the same quarter of the previous year). Of this, telephone sets was 0.9 billion yen (-8.5% over the same period of the previous year), push-button telephones 6.3 billion yen (-8.3%), and intercoms 13.2 billion yen (-23.8%). Demand for intercoms and push-button telephones decreased significantly due to a decline in buyers’ motivation amid the spread of COVID-19 and delays in starting the construction of housing and office buildings.

  2. Mobile terminal equipment

    75.7 billion yen (-7.0% over the same period of the previous year). Of which, mobile phones was 52.1 billion yen (-9.5% over the same period of the previous year). Demand for mobile phones weakened and domestic production decreased chiefly due to a decline in buyers’ motivation amid the spread of the COVID-19 coronavirus and restrained purchasing before the release of 5G terminals.

  3. Wireline network equipment

    73.0 billion yen (+20.9% over the same period of the previous year). Of this, central office switching systems was 7.3 billion yen (+ 90.5% over the same period of the previous year), private branch exchanges (PBXs) was 1.4 million yen (-56.6% over the same period of the previous year), digital transmission equipment was 32.7 billion yen (+55.7% over the same period of the previous year) and other transmission equipment was 28.3 billion yen (-3.3% over the same period of the previous year). Domestic production of private branch exchanges decreased considerably, reflecting a decrease in opportunities to use fixed line telephones and a reduction in offices due to an increase in working from home. Domestic production of digital transmission equipment continues to increase due to strong demand for backbone network equipment, in line with the construction of 5G telecommunication infrastructure and the nationwide development of optical cable networks.

  4. Wireless network equipment

    27.9 billion yen (+10.6% over the same period of the previous year). This includes 10.6 billion yen (-10.0% over the same period of the previous year) for fixed telecommunication devices and 17.3 billion yen (+28.5% over the same period of the previous year) for base station communication equipment. While domestic production of fixed telecommunication devices decreased due to sluggish private capital expenditures, domestic production of base station communication equipment continues to increase for the construction of 5G communication infrastructure.

  5. Network access equipment

    13.4 billion yen (-24.6% over the same period of the previous year). Because of the COVID-19 pandemic, network traffic increased due to teleworking and online meetings, and demand for telecommunications carriers and government offices is strong. However, domestic production of network access equipment decreased year on year owing mainly to a decrease in capital expenditures by private companies and a drop in unit prices due to intensifying price competition.

  6. Wireline parts (relays and repeaters for wired equipment)

    12.0 billion yen (-11.9% over the same period of the previous year). Component production continues to decline due to a fall in the exports of components for smartphones manufactured overseas.

IV. Exports

(Compiled by CIAJ, based on Ministry of Finance’s “Trade Statistics”)

(1) Detailed trends by categories

Actual figures by category for FY2020 H1 are as follows:

  1. Telephone sets and terminal equipment9.2 billion yen (-23.6% over the same period of the previous year).

    Of this, mobile phones was 7.5 billion yen (-29.7% over the same period of the previous year), cordless handsets for landline phones was 120 million yen (+6.5% over the same period of the previous year), and other was 1.6 billion yen (+23.0% over the same period of the previous year). Mobile phones continued to decrease due to the impact of the overseas economic downturn.

  2. Network equipment48.9 billion yen (-18.5% over the same period of the previous year).

    Of which, base stations were 400 million yen (-67.3% over the same period of the previous year), data communication equipment was 47.3 billion yen (-16.3% over the same period of the previous year) and other network equipment was 1.2 billion yen (-46.2% over the same period of the previous year). Exports of data communication equipment have been sluggish due to a significant decrease in demand caused by a slowdown in the overseas economies.

  3. Parts (both wireline and wireless)74.0 billion yen (-13.2% over the same period of the previous year)

    Although the value of exports decreased to one-third of that of maximum exports, exports are picking up due to increasing demand for 5G-related parts and those for data centers.

(2) Detailed trends by region

The results by region for the April through September period include 81.9 billion yen for Asia (-14.8% over the same period of the previous year), in which exports to China totaled 24.1 billion yen (-27.6% over the same period of the previous year). North America was 32.2 billion yen (-10.6% over the same period of the previous year), of which the U.S. was 31.7 billion yen (-10.9% over the same period of the previous year). Europe was 14.4 billion yen (-27.7% over the same period of the previous year), of which the EU was 10.6 billion yen (-38.1% over the same period of the previous year).  The percentage of exports to China in total exports further decreased to 18.3% due to trade and other issues. In addition, exports to the United States and Europe, where there is concern about the spread of the COVID-19 coronavirus accelerating again, are declining.

(3) Comparison and breakdown by region

First:Asia62.0% (+0.8% over the same period of the previous year)
Second:North America24.3% (+1.4% over the same period of the previous year)
Third:Europe10.9% (-1.7% over the same period of the previous year)
Other regions:2.8% (-0.5% over the same period of the previous year)

V. Imports

(Compiled by CIAJ, based on Ministry of Finance’s “Trade Statistics”)

(1) Detailed trends by categories

Actual figures by category for FY2020 H1 are as follows:

  1. Telephone sets and terminal equipment587.5 billion yen (-16.8% over the same period of the previous year)

    This includes 581.6 billion yen for mobile phones (-17.0% over the same period of the previous year), 2.3 billion yen for cordless phones (-2.2% over the same period of the previous year), and 3.6 billion yen for other products (+9.4% over the same period of the previous year). With regard to mobile phones, imports of smartphones decreased, reflecting a fall in demand due to restrained purchasing and other factors as well as new products from overseas manufacturers which were released in a different month in the previous year.

  2. Network equipment424.7 billion yen (+17.1% over the same period of the previous year)

    This includes 37.4 billion yen for base stations (+84.4% over the same period of the previous year), 377.8 billion yen for data communication equipment (+13.4% over the same period of the previous year), and 9.5 billion yen for other network-related apparatuses (+3.5% over the same period of the previous year). Imports of switching equipment and routing equipment as well as “other products (transmission equipment, communications equipment, modems, etc.)” in data communication equipment increased due to growth in demand for network capital expenditure.

  3. Parts (both wireline and wireless)108.0 billion yen (+6.6% over the same period of the previous year)

(2) Detailed trends by region

The results by region for the April through September period include 1,043.2 billion yen from Asia (-4.1% over the same period of the previous year), in which imports from China totaled 771.3 billion yen (-7.6% over the same period of the previous year). North America was 28.4 billion yen (-21.2% over the same period of the previous year), of which the U.S. accounted for 26.0 billion yen (-23.5% over the same period of the previous year). Europe was 31.0 billion yen (+36.4% over the same period of the previous year), of which the EU was 30.5 billion yen (+39.1% over the same period of the previous year). Regarding imports from Europe, imports of parts (up 126.8%) and base stations (up 1,116.0%) are increasing.

(3) Comparison and breakdown by regions

First:Asia93.1% (+0.1% over the same period of the previous year)
Second:North America2.5% (-0.6% over the same period of the previous year)
Third:Europe2.8% (+0.9% over the same period of the previous year)
Other regions:1.6% (-0.4% over the same period of the previous year)

VI. Trends in Orders Received and Shipped

(1) Results for the first half of FY2020 (April through September 2020)

CIAJ statistics for total orders received and shipped in April through September amounted to 660.6 billion yen, representing a decrease of 12.2% year on year. This includes 547.4 billion yen for domestic shipments, which fell by 8.5% year on year, and 113.1 billion yen for exports, which dropped 26.6% year on year.

*CIAJ statistics for total orders received and shipped = orders received and shipped by CIAJ member companies in Japan
(=value of shipments for the domestic market (domestic production + foreign production) + value of exports = value of domestic production + value of imports of products produced abroad)

(2) Trends by category

Actual figures by category for FY2020 H1 are as follows:

  1. Wireline terminal equipment 218.1 billion yen (-19.3% over the same period of the previous year)

    Overall orders for wireline terminal equipment received and shipped fell significantly year on year, reflecting a decrease in domestic demand for cordless phones and intercoms due to the impact of the coronavirus pandemic, as well as a fall in the exports of home use fax machines (including multifunction home use fax machines) and business use fax machines (including multifunction business use fax machines).

  2. Mobile terminal equipment 196.2 billion yen (-8.6% over the same period of the previous year)

    Demand for mobile phones was sluggish, principally due to restrained purchasing. Exports of other mobile terminal apparatuses (wireless systems for disaster control, commercial use, etc.) were strong.

  3. Wireline network equipment 110.8 billion yen (+8.0% over the same period of the previous year)

    Orders for business-related devices such as push-button telephones and private branch exchanges dropped, reflecting the decreased use of land lines and reduced offices due to teleworking, impacted by work style reforms during the COVID-19 pandemic. On the other hand, orders for wireline network equipment as a whole increased year on year thanks to continued strong demand for digital transmission equipment and PON/MC in Japan.

  4. Wireless network equipment 106.4 billion yen (-17.7% over the same period of the previous year)

    Although demand for base station communication equipment used for mobile phones is increasing ahead of the commercialization of 5G services, overall orders for wireless network equipment decreased year on year due to a considerable decline in demand for terrestrial communication equipment for public offices and the private sector and satellite communication equipment for public offices, demand for which was high in the same period of the previous year.

  5. Other network equipment 16.5 billion yen (-23.4% over the same period of the previous year)

    Despite the unchanging level of orders for routers, orders for LAN switches decreased significantly due to sluggish private capital expenditure. As a result, orders for other network equipment as a whole decreased year on year.

  6. Communication equipment parts 12.6 billion yen (-11.2% over the same period of the previous year).

CIAJ Releases Report on the Study of Mobile Device Use – 5G service recognition high as smartphone penetration nears 100% –

CIAJ conducted its annual study of mobile device use and announces the release of FY2020 findings as follows:

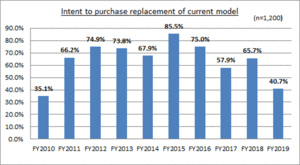
This year’s findings revealed smartphone penetration had reached 98.3%, or almost 100%. On the other hand, the renewal intention dropped by 12 points over the previous year to 29%, which is approximately a third of the peak figure reached in 2015.

The ratio of subscribers to low cost carriers made up of “sub-brands (Y!Mobile, UQ mobile)” operated by the major carriers (MNOs) and MVNOs remained basically the same at 22.9%. There is strong pressure to decrease communication charges. However, the awareness of offers that separate communication charges from device payments is only about 60%, reflecting slower than expected transition to low-cost offers and any major trend to change the status quo is yet to be seen.

The major topic for this year’s study is the launch of 5G services. Recognition of 5G is high at 85%, but only a little over 1% were taking advantage of the service as of early August when the study was conducted. Interest and expectations are high for 5G services, so a rise in uptake is projected.

The other topic this year is the transition to the “new normal society” resulting from COVID-19. This year’s study revealed that use of mobile devices to work from home (on-line meetings) and attend remote classes have increased and approximately half of those surveyed are using some form of mobile/on-line payment. The new normal society is expected to uncover and promote new uses of mobile devices.

(1) Summary

Since 1998, this study has been conducted as a fixed-point observation every April to capture the March sales period, the busiest of the year. However, with the COVID-19 impact this year, the study was conducted from July into early August.

CIAJ post-mailed questionnaires to 1,200 mobile phones users (100 male & 100 female users in each of the following age groups: under twenty, twenties, thirties, forties, fifties, sixties) residing in the larger Tokyo and Osaka metropolitan areas. In addition, of the 1,200 surveyed in the study, the 16 who responded as using 5G services and an additional 100 (chosen randomly) 5G users were surveyed (a total of 116 users) further in order to better understand the state of 5G service use.

Unique findings from this year’s study are as follows.

(2) Device Trends

<Type of device owned>

  • The 1,200 people surveyed owned a total of 1,585 devices in the categories listed in the table below.
  • 1,180 respondents (98.3%) said their main-use device was a smartphone, while 19 respondents (1.6%) said it was a feature phone.
    <Type of device owned by respondents>
    Type of device ownedNo. of devices
    (multiple answers possible)
    Unit: devices
    Main-use device
    Smartphone1,228 (102.3%)1,180 (98.3%)
    Feature-phone24 (2.0%)19 (1.6%)
    Tablet (with telecom subscription)320 (26.7%)1 (0.1%)
    Tablet (only Wi-Fi connectivity)5 (0.4%)0
    Mobile Wi-Fi router1 (0.1%)0
    Other (PHS)00
    No answer7
    Total1,585 (132.1%)1,200 (100.0%)

<Smartphone users approach 100%>

  • Smartphone use has gained popularity in all age groups, including respondents in their 60s, with the growth rate over the previous year at 2.0% and approaching 100%.

<Continuing decline in featurephone users>

  • Featurephone users also decreased by 1.7 points over the previous year to 1.6%.

<Slower decrease in respondents using multiple devices>

  • 32.2% of respondents stated they use multiple devices, which is a slight decline over the previous year (32.9%).
  • Of those using multiple devices, 82.9% (319 devices) were tablets (with telecom subscription) and 12.5% (48 devices) were smartphones.

(3) User Trends Among Low-Cost Carrier Services

<Increase in user satisfaction among low-cost carrier subscribers>

  • 22.9% (n=1,174) of respondents were using low-cost carrier services, which includes MVNOs as well as “sub-brands” operated by the major carriers (MNOs), and has basically not changed over the previous year.
  • Overall satisfaction rates over contracts with low-cost carriers were high and satisfaction concerning devices were higher than the previous year in all categories.
  • Dissatisfaction over post-sales service fell by 9.8 points from 17.2% to 7.4% this year. Dissatisfaction over speed fell likewise by 4.6 points from 17.5% to 12.9%.

(4) Intent to purchase replacement device

<Low intention to replace devices continues>

  • 29.2% of respondents indicated intention to purchase a replacement, which was 11.5 points lower than last year’s 40.7%. This figure is now approximately a third of what it was at its peak in 2015, indicating the further decline in intention to replace current devices.

<Use of current device becomes longer>

  • The duration of use of previously purchased device was 31.2 months in 2018, 35.2 months in 2019 and 36.6 months in 2020, increasing by more than 5 months over the two years and reflecting longer use of their current devices.

(5) Decisive Factors for New Purchases

<No change in top 4 factors, with 5G ranking for first time at 6th>

  • There was no significant change in the top 4 decisive factors, including the response rate, with the top 2 continuing to pertain to price and costs.
  • On the other hand, “water-proof,” “long battery life” and “high-speed compatibility” continued to rank in the top 11 decisive factors, but all three dropped considerably by more than 20 points.
  • The newly added “5G device” ranked 6th at 26.0%
    <Decisive factors in purchasing new devices>
    Factor% of response
    (change over 2019)
    2019 ranking
    (% of response)
    Purchase price of device81.0% (-3.4)1 (84.4%)
    Monthly payment cost76.3% (-3.8)2 (80.1%)
    Mobile telecom carrier67.6% (-3.2)3 (70.8%)
    Manufacturer/brand67.6% (+0.9)4 (66.7%)
    Water-proof28.5% (-20.1)6 (48.6%)
    5G device26.0% (-)new item
    Long battery life19.2% (-32.3)5 (51.5%)
    Camera features &functions13.1% (-12.4)11 (25.5%)
    Design/feel13.0% (+5.7)23 (7.3%)
    Beautiful display12.4% (+0.6)15 (11.8%)
    High-speed compatibility11.6% (-36.3)7 (47.9%)
    Size (snugness in one’s hand)10.3% (+1.7)20 (8.6%)

(6) Use of Features and Services

<Surge in video viewership and IP phone use, with big drop in SMS and marketplace apps>

  • Features and services which rose by 20 points or more were “traditional text-based e-mail” “watching videos (YouTube, etc.),” “IP phone voice communication (LINE, SKYPE, etc.)” and “searching & browsing (excluding news and newspaper sites).”
  • Features and services which dropped by 20 points or more were “SMS (short mail using phone number),” “selling/purchasing via marketplace apps (Mercari, etc.)” and “chatbot (interacting with AI chat services).”

(7) Interest in services and future trends

<More than half of respondents use mobile cashless payment services>

  • 51.8% or more than half of respondents were already using mobile cashless payment services.
  • Of the respondents using contactless IC payment services, 96.6% were using “mobile wallet” Of the respondents using QR code payment services, 60.2% were using “LINE PAY,” 41.7% were using “PayPay,” 33.9% were using “Rakuten Pay” and 31.1% were using “d Payment.”

(8) Current and potential use of 5G Services

<Awareness of 5G high, but users of the service remain below 2%>

  • 42.7% of respondents “had an understanding” of 5G, 42.7% “only recognized the terminology” and together, tally up to approximately 85% awareness of the service, which is higher than 73% recorded in the previous year.
  • On the other hand, only 16 people responded that they were using 5G services (as of July through early August), or 1.3% of 1,200 people surveyed.

<Approximately 40% of respondents plan to use 5G services>

  • Of the respondents who were not currently using 5G services, 16.2% “planned to use” and 21.0% “would like to use but was undecided about when to start.” Together, these figures amount to 37.2% who plan to use 5G services.

<Many 5G users were satisfied with the fees, but were dissatisfied about connectivity>

  • The following figures were tabulated from the 16 of 1,200 respondents to this year’s survey who were already using 5G services and a separate 100 people who were also using 5G services for a total of 116.
  • The impression of having used 5G services were as follows. Although 67.2% were satisfied about certain aspects, 74.1% were at the same time dissatisfied about certain aspects. High satisfaction items were “5G pricing plans” at 91.0% (71 respondents) and “price of 5G devices” at 69.2% (54 respondents). Respondents were dissatisfied with “connectivity” at 100% (86 respondents) and “5G service contents” at 31.4% (27 respondents.

(9) Impact of COVID-19 on the use of mobile devices

<Mobile device use increases among 1 in 3 respondents as a result of COVID-19>

  • 35.1% of respondents said that the frequency of their use of mobile devices had “increased” as a result of COVID-19, while 63.2% said that their use “had not changed,” indicating that 1 in 3 respondents are using their mobile devices more.
  • The reason behind the increased use of their mobile devices includes the following: “telework (on-line meetings)” 46.1%, “on-line classes” 37.5% and “on-line events (parties, music performances)” 10.2%.

(Reference) Plans separating communication charges from device payments

<About 60% aware of separate payment plan, but over 90% don’t take advantage>

  • 58.6% of respondents “knew” about plans which separate communication charges from device payments, but 91.8% of these respondents had not switched payment plans.

Telecommunication Equipment Production and Trade Figures for the First Quarter (April-June) of FY2020 – Demand for network equipment was strong, unaffected by COVID-19 –

The Communication and Information network Association of Japan (CIAJ) announces the telecommunication equipment production and trade figures for Q1 (April-June) of FY2020 as follows.

I. Summary

In April through June 2020, the Japanese economy shrank for a third consecutive quarter, with real GDP decreasing at an annual rate of 27.8%, according to preliminary estimates. As private consumption and business spending weakened amid the stagnation of economic activity triggered by declaration of a state of emergency and other effects of the COVID-19 pandemic, domestic demand contracted for a third consecutive quarter. With inbound demand falling sharply as well due to the pandemic, exports also fell for a second straight quarter.

Looking specifically at the telecom market, demand for consumer equipment and business equipment declined, reflecting weaker private consumption and business spending. However, demand for network equipment was strong. In preparation for an increase in traffic stemming chiefly from the utilization of 5G (fifth-generation mobile communication systems) services, demand for wireline network equipment which will form the backbone network continued to increase. Bolstered also by an uptick in demand for mobile phone infrastructure equipment coinciding with expansion of network equipment for carriers and data centers primarily to meet telework demand, demand for network equipment grew.

(1) Domestic Market Trends

The value of the domestic market (= value of domestic production – value of exports + value of imports) in April through June was 598.2 billion yen, increasing 6.0% year on year, the first growth for four quarters.
Due to the growth in demand for network equipment, the value of domestic production and the value of imports increased.

(2) Domestic Production

The value of domestic production in April through June was 106.0 billion yen, representing positive growth of 4.8% over the same quarter of the previous year and marking the second straight positive quarter. Domestic production increased overall due to strong year-on-year performances in digital transmission equipment and base station communications equipment for infrastructure projects, offsetting decline in telephone sets and mobile phones for consumers and key phones and PBX for business use.

(3) Exports

The total value of exports in April through June was 61.3 billion yen, representing negative growth of 21.0% over the same quarter of the previous year and continuing a streak of sharp declines. Against the backdrop of weakening smartphone demand in China and other Asian economies, demand for parts used in local smartphone production decreased, and, with production also suspended in response to COVID-19, exports of parts used in the production of smartphones fell sharply. Business spending also fell due to the recession, and the total value of exports fell for a seventh straight quarter.

(4) Imports

The total value of imports in April through June was 580.5 billion yen, representing positive growth of 2.1% over the same quarter of the previous year and moving into positive territory for the first time in four months. The total value of imports increased due to growth in switching and routing equipment, and other data telecom equipment (transmission equipment, communications equipment, modem, etc.) in the data telecom equipment category resulting from strong domestic demand for wireline network equipment.

II. Domestic Market Trends

(Aggregated by CIAJ based on Indices of Industrial Production and Trade Statistics of Japan)

(1) Detailed trends by categories

Actual figures for April through June by category are as follows.

The size of the domestic market (including the value of imports of foreign brands) was calculated from government figures, the Indices of Industrial Production and Trade Statistics of Japan, according to the following formula: Domestic market size = value of domestic production – value of exports + value of imports

  1. Terminal equipment :
    371.7 billion yen (-1.5% over the same quarter of the previous year)

  2. Network equipment :
    226.5 billion yen (+21.1% over the same quarter of the previous year)

III. Domestic Production

(Aggregated by CIAJ based on Indices of Industrial Production compiled by the Ministry of Economics, Trade and Industry)

(1) Detailed trends by categories

Actual figures for April through June by category are as follows.

  1. Wireline terminal equipment 10.2 billion yen (-11.4% over the same quarter of the previous year)

    Of this, telephone sets declined to 400 million yen (-7.4% over the same quarter of the previous year), key telephones to 3.1 billion (-3.7% over the same quarter of the previous year), and intercoms to 6.6 billion (-14.9% over the same quarter of the previous year).
    Demand for categories that meet personal and household use showed signs decline due to lost buying opportunities and delays in new construction because of COVID-19.
    Domestic production of key phone also remained in a downward trend partly due to decline in business spending caused by COVID-19, offsetting growth in demand for large capacity models of the shift away from PBX.

  2. Mobile terminal equipment 37.5 billion yen (+6.5% over the same quarter of the previous year)

    Of which, mobile phones was 23.8 billion yen (-16.5% over the same quarter of the previous year).

    The total volume and value of domestic mobile phone production decreased mainly due to lost in-store buying opportunities, despite an increase in domestic smartphone production volume on the back of firm smartphone replacement demand.
    Domestic production of other mobile terminal equipment besides mobile phones increased sharply mainly due to the replacement of commercial radio terminals and marine and aeronautical radio communication equipment.

  3. Wireline network equipment 32.6 billion yen (+18.9% over the same quarter of the previous year)

    Of which, central office switching systems was 2.4 billion yen (+ 48.0% over the same quarter of the previous year), PBXs was 700 million yen (-49.0% over the same quarter of the previous year), digital transmission equipment was 14.6 billion yen (+67.5% over the same quarter of the previous year) and other transmission equipment was 13.5 billion yen (-6.6% over the same quarter of the previous year).
    Domestic production of digital transmission equipment continued to grow due to expansion of wireline network equipment in anticipation of an increase in data traffic and greater investment in regions where optical cables have yet to be laid.
    Exports also rose due to global internet traffic supply shortage.
    Domestic production of PBXs decreased, reflecting weak demand amid decline in business spending and the streamlining and consolidation of domestic bases in response to deterioration in corporate earnings, despite government replacement demand.

  4. Wireless network equipment 12.5 billion yen (+3.7% over the same quarter of the previous year)

    Of which, fixed telecommunication devices were 5.0 billion yen (-13.6% over the same quarter of the previous year) and base station equipment was 7.5 billion yen (+19.5% over the same quarter of the previous year).
    Domestic production of fixed communications equipment decreased due to decline in demand for emergency radio base stations and satellite communications equipment for government and microwave communication equipment for the private sector.
    The basic tendency for domestic production of base station equipment to remain flat continued despite growth over the same quarter of the previous year.

  5. Network access equipment 6.9 billion yen (-15.1% over the same quarter of the previous year)

    Domestic production of network access equipment fell, reflecting decline in overall demand due to constraints on business spending despite expansion of carrier and data center equipment to accommodate telework demand fueled by COVID-19.

  6. Wireline parts (includes relay equipment for wireline systems) 6.3 billion yen (-7.9% over the same quarter of the previous year)

    Production continued to fall due to decline in demand for domestic production especially automotive products and decline in exports for the overseas production of smartphones for export.

IV. Exports

(Compiled by CIAJ, based on Ministry of Finance’s “Trade Statistics”)

(1) Detailed trends by categories

Actual figures for April through June by category are as follows (the facsimile category is no longer indicated from January 2018):

  1. Telephone sets and terminal equipment 6.3 billion yen (-21.0% over the same quarter of the previous year)

    Of this, mobile phones was 5.5 billion yen (-6.6% over the same quarter of the previous year), cordless handsets for landline phones was 70 million yen (+ 18.3% over the same quarter of the previous year), and other was 800 million yen (+34.4% over the same quarter of the previous year).
    Exports of mobile phones to Asia increased, while exports to the U.S. decreased.

  2. Network equipment 21.8 billion yen (-26.7% over the same quarter of the previous year)

    Of which, base stations was 200 million yen (-68.6% over the same quarter of the previous year), data communication equipment was 20.9 billion yen (-24.6% over the same quarter of the previous year) and other network equipment was 600 million yen (-50.2% over the same quarter of the previous year).
    Exports were weak, reflecting decreased demand amid the global economic slump caused by COVID-19.

  3. Parts (both wireline and wireless) 33.2 billion yen (-19.8% over the same quarter of the previous year)

    Exports of parts used in production fell due to global decline in the consumption of smartphones due to COVID-19 and deterioration in business spending against the backdrop of worsening trade tensions between the U.S. and China.

(2) Detailed trends by region

A breakdown of results for April through June by region shows that Asia was 35.5 billion yen (-21.2% over the same quarter of the previous year), of which China was 9.3 billion yen (-35.3% over the same quarter of the previous year). North America was 17.3 billion yen (-9.1% over the same quarter of the previous year), of which the U.S. was 17.1 billion yen (-9.2% over the same quarter of the previous year).
Europe was 6.2 billion yen (-39.8% over the same quarter of the previous year), of which the EU was 5.5 billion yen (39.9% over the same quarter of the previous year).

Exports to major export destinations such as Asia, Europe and the U.S. fell sharply due to the effects of COVID-19.

(3) Comparison and breakdown by regions

First:Asia58.0% (-0.2%over the same quarter of the previous year)
Second:North America28.3% (+1.7% over the same quarter of the previous year)
Third:Europe10.2% (-3.1% over the same quarter of the previous year)
 Other regions3.5% (+1.6% over the same quarter of the previous year)

V. Imports

(Compiled by CIAJ, based on based on Ministry of Finance’s ‘Trade Statistics”)

(1) Detailed trends by categories

Actual figures for April through June by category are as follows

  1. Telephone sets and terminal equipment 330.4 billion yen (-2.0% over the same quarter of the previous year)

    Of this, mobile phones was 327.9 billion yen (-2.0% over the same quarter of the previous year), cordless handsets for landline phones was 700 million yen (-39.7% over the same quarter of the previous year), and other was 1.7 billion yen (+13.9% over the same quarter of the previous year). Demand for mobile phones fell mainly due to lost in-store buying opportunities. Growth in the other category includes increased demand for remote conference systems.

  2. Network equipment 196.2 billion yen (+16.0% over the same quarter of the previous year)

    Of which, base stations was 19.6 billion yen (+122.1% over the same quarter of the previous year), data communication equipment was 172.1 billion yen (+10.6% over the same quarter of the previous year) and other network equipment was 4.6 billion yen (-2.2% over the same quarter of the previous year).
    Demand for digital transmission equipment which will form the backbone of networks grew and demand for mobile phone infrastructure also went up, causing exports in these categories to rise.

  3. Parts (both wireline and wireless) 54.0 billion yen (+13.2% over the same quarter of the previous year)

(2) Detailed trends by region

A breakdown of results for April through June by region shows that Asia was 545.2 billion yen (+6.6% over the same quarter of the previous year), of which China was 406.2 billion yen (+8.4% over the same quarter of the previous year). North America was 13.8 billion yen (-24.4% over the same quarter of the previous year), of which the U.S. accounted for 13.3 billion yen (-22.7% over the same quarter of the previous year). Europe was 12.6 billion yen (+17.9% over the same quarter of the previous year), of which the EU was 12.4 billion yen (+19.8% over the same quarter of the previous year). Imports of parts and base stations rose sharply, driven by increased imports from China and Europe.

(3) Comparison and breakdown by regions

First:Asia93.9% (+1.6% over the same quarter of the previous year)
Second:North America2.2% (+0.3% over the same quarter of the previous year)
Third:Europe2.4% (-0.9% over the same quarter of the previous year)
 Other regions1.5% (-1.0% over the same quarter of the previous year)

VI. Trends in Orders Received and Shipped

(from CIAJ statistics)

(1) FY2020 1st quarter actual

CIAJ statistics for total orders received and shipped in April through June amounted to 322.1 billion yen, representing negative growth of 12.3% over the same quarter of the previous year. Of which, the total value of domestic shipments was 272.0 billion yen, representing negative growth of 7.2% over the same quarter of the previous year) and exports was 50.1 billion yen, representing negative growth of 32.5% over the same quarter of the previous year).

*CIAJ statistics for total orders received and shipped = orders received and shipped by CIAJ member companies
(=value of shipments for the domestic market (domestic production + foreign production) + value of exports = value of domestic production + value of imports of products produced abroad)

(2) Trend by categories

Actual figures for April through June by category are as follows:

  1. Wireline terminal equipment 92.5 billion yen (-26.9% over the same quarter of the previous year).

    Domestic demand for consumer equipment and business equipment fell, and exports of personal and office-use facsimiles (including multi-functioning devices), which are particularly sensitive to the effects of overseas economies, fell sharply.

  2. Mobile terminal equipment 107.0 billion yen (-12.8% over the same quarter of the previous year).

    Domestic demand for mobile phones shrank due to weak consumption dampened by COVID-19 in addition to falling demand largely due to the lengthening of the replacement cycle. Imports of other mobile equipment (commercial/MCA radio terminals, etc.) were firm.

  3. Wireline network equipment 54.0 billion yen (+16.5% over the same quarter of the previous year).

    Demand for wireline network equipment such as digital transmission equipment, PON and media converters increased sharply and exports of digital transmission equipment were also solid.

  4. Wireless network equipment 55.7 billion yen (+1.4% over the same quarter of the previous year).

    Domestic demand for fixed communications equipment shrank due to decline in demand for emergency radio base stations and satellite communications equipment for government and microwave communication equipment for the private sector. Meanwhile, exports of satellite communications equipment grew. Demand for base station equipment for carriers grew considerably.

  5. Other network equipment 6.8 billion yen (-31.3% over the same quarter of the previous year).

    Demand decreased, reflecting lackluster business spending due to COVID-19.

  6. Communication equipment parts 6.1 billion yen (-14.1% over the same quarter of the previous year)

Telecommunication Equipment Production and Trade Figures for FY2019 (April-March) –Domestic production increased for the first time in 14 years, reflecting firm results for equipment related to networks–

The Communication and Information network Association of Japan (CIAJ) announces the telecommunication equipment production and trade figures for FY2019 (April-March) as follows.

I. Overview

In the January-March quarter of 2020, the Japanese economy recorded an annualized quarter-over-quarter real GDP growth of minus 3.4% (first preliminary estimate released on May 18), negative growth for the second consecutive quarter. Private consumption declined due to stay-at-home requests to contain the spread of the coronavirus before it recovered from a fall following the consumption tax hike. Capital investment was postponed because of sluggish construction work and machine production in the second half of the fiscal year and decreased. Exports fell, reflecting a slowdown in the world economy, and imports slipped chiefly due to sluggish domestic demand.

Looking specifically at the telecom market, demand for smartphones fell primarily due to a wait-and-see situation before and after the revision to the Telecommunications Business Act, a decline in purchase motivations mainly because of the spread of the coronavirus, and a slowdown in purchases before launches of 5G (fifth-generation mobile communication systems) terminals, despite the increased replacement of traditional feature phones. Meanwhile, in anticipation of an increase in data traffic due to the use of 5G, demand for equipment related to wireline networks, backbone systems, increased. Demand for mobile phone infrastructure equipment, including base stations and routers, is increasing.

(1) Domestic Market Trends

In FY2019, the total value of the domestic market (value of domestic production – value of exports + value of imports; excluding parts) stood at 2,700.5 billion yen, down 7.4% year over year. This reflected a decrease in imports of domestic-brand mobile phones manufactured overseas and foreign-brand ones.

(2) Domestic Production

The total value of domestic production in FY2019 was 493.1 billion yen, an increase of 3.8% over FY2018. Domestic production rose year over year for 10 consecutive months and annual domestic production increased year over year for the first time in 14 years, since FY2005 due to strong demand for digital transmission equipment and network access equipment in anticipation of an increase in data traffic and solid exports of commercial radio terminals and other mobile terminals.

(3) Exports

The total figure for exports in FY2019 was 307.4 billion, a decrease of 22.7% over FY2018, falling significantly for the second consecutive year and the ninth consecutive quarter. Exports in almost all categories, particularly parts used in the production of smartphones, decreased, reflecting a continued slowdown in the world economy.

(4) Imports

The total figure for imports in FY2019 was 2,578.3 billion yen, a decrease of 9.6% over FY2018, falling for the second consecutive year and the third consecutive quarter. Imports of domestic-brand mobile phones manufactured overseas and foreign-brand ones dropped significantly due to a decrease in demand for smartphones in Japan. Meanwhile, imports for the development of 5G base stations grew.

II. Domestic Market Trends

(Aggregated by CIAJ based on Indices of Industrial Production and Trade Statistics of Japan)

(1) Detailed trends by category

Actual figures by category for FY2019 are as follows. Network equipment continued to grow.

  1. Terminal equipment 1,824.2 billion yen (-13.6% over FY2018)

  2. Network equipment 877.3 billion yen (+9.0% over FY2018)

The size of the domestic market (including the value of imports of foreign brands) was calculated from government figures, the Indices of Industrial Production and Trade Statistics of Japan, according to the following formula:

Domestic market size = value of domestic production – value of exports + value of imports

III. Domestic Production

(Based on Indices of Industrial Production compiled by the Ministry of Economics, Trade and Industry)

(1) Wireline terminal equipment

Actual figures by category in FY2019 were as follows (the statistics from January 2018 to December 2019 were revised, and the statistics particularly for mobile phones change):

  1. Wireline terminal equipment

    49.0 billion yen (-5.1% over FY2018).
    Of this, telephone sets was 2.0 billion yen (-38.6% over FY2018), key telephones 14.1 billion (-12.3%), and intercoms 33.0 (+1.9%). Private consumption and business spending were sluggish in the latter half of the fiscal year due to the consumption tax hike and the spread of the coronavirus, and domestic production of equipment for household use and business use declined.

  2. Mobile terminal equipment

    176.0 billion yen (+6.8% over FY2018). Of which, mobile phones (including public-use PHS) was 107.6 billion yen (-6.5% over FY2018).
    Of this, mobile phones manufactured in Japan fell, while other land telecommunication devices, including commercial/simple radio telecommunication devices, rose.

  3. Wireline network equipment

    134.3 billion yen (+8.5% over FY2018). Of which, central office switching systems was 9.0 billion yen (+1.7% over FY2018), PBXs was 5.5 billion yen (-24.7% over FY2018), digital transmission equipment was 48.8 billion yen (+13.1% over FY2018) and other transmission equipment was 63.9 billion yen (+9.7% over FY2018).
    PBXs declined due to the economic slowdown, which resulted in a reduced willingness for capital expenditure, as well as the consolidation of bases of companies and a reduction in the number of lines resulting from FMC. Meanwhile, in central office switching systems, demand for accommodation and conversion equipment that is necessary for the transition from public switched telephone networks to IP networks increased. Domestic production and exports of digital transmission equipment rose, reflecting telecom companies’ investment in metro networks in response to increasing data traffic.

  4. Wireless network equipment

    64.9 billion yen (-11.2% over FY2018). Of which, fixed telecommunication devices ware 29.1 billion yen (-12.8% over FY2018) and base station equipment was 35.8 billion yen (-9.9% over FY2018).

  5. Network access equipment

    43.0 billion yen (+32.9% over FY2018).
    Demand increased, chiefly reflecting the strengthening of network systems for commercial 5G services, the handling of increasing data traffic for video services, and the development of office networks in response to the spread of the coronavirus.

  6. Wireline parts (includes relay equipment for wireline systems)

    25.9 billion yen (-12.0% over FY2018).
    Exports of parts used in the production of smartphones in emerging countries declined, and production of parts continued.

IV. Exports

(Compiled by CIAJ, based on based on Ministry of Finance’s “Trade Statistics”)

(1) Detailed trends by category

Actual figures by category for FY2019 are as follows:

  1. Telephone sets and terminal equipment 22.0 billion yen (-26.2% over FY2018)

    Of this, mobile phones was 19.1 billion yen (-29.3% over FY2018), cordless handsets for landline phones was 0.3 billion yen (-12.5% over FY2018), and other was 2.6 billion yen (+6.5% over FY2018). Exports of mobile phones to the United States fell, and exports of commercial radio terminals, etc. including in the other category to the U.S. increased.

  2. Network equipment 123.5 billion yen (-5.5% over FY2018)

    Of this, base stations was 2.5 billion yen (-43.3% over FY2018), data communication equipment was 117.3 billion yen (-4.4% over FY2018), and other network equipment was 3.7 billion (+6.6% over FY2018). Demand continued to decline due to the slowdown in the world economy, but exports of other network equipment to countries in Asia rose.

  3. Parts (both wireline and wireless) 161.9 billion yen (-31.7% over FY2018)

    Exports of parts used in the production of smartphones continued to fall due to the sluggish production of smartphones in emerging countries in Asia because of declining demand and production stoppage caused by the spread of the coronavirus.

(2) Detailed trends by region

A breakdown of results for FY2019 by region shows that Asia was 184.5 billion yen (-29.4% over FY2018), of which China was 60.0 billion yen (-50.9% over FY2018). North America was 70.3 billion yen (-15.5% over FY2018), of which the U.S. was 69.5 billion yen (-15.4% over FY2018). Europe was 41.2 billion yen (+7.0%), of which the EU was 33.8 billion yen (+0.4%). The percentage of exports to China to total exports decreased to 19.5% due to the large impact of a fall in exports of parts used in the production of smartphones.

(3) Comparison and breakdown by regions

First:Asia60.0% (-5.7% over FY2018)
Second:North America22.9% (+1.9% over FY2018)
Third:Europe13.4% (+3.7% over FY2018)
Other regions3.7% (+0.1% over FY2018)

V. Imports

(Compiled by CIAJ, based on based on Ministry of Finance’s “Trade Statistics”)

(1) Detailed trends by category

Actual figures by category for FY2019 are as follows.
(the statistics from January 2019 to December 2019 were revised.)

  1. Telephone sets and terminal equipment 1,621.2 billion yen (-15.7% over FY2018)

    Of this, mobile phones was 1,609.8 billion yen (-15.8% over FY2018), cordless handsets for landline phones was 4.5 billion yen (-11.4% over FY2018) and other was 6.9 billion yen (+2.9% over FY2018). Imports of domestic brands manufactured overseas and foreign brands decreased mainly due to the coronavirus. Imports of video conference and conference call systems, which are included in the other category, from Asian countries rose.

  2. Network equipment 757.6 billion yen (+7.4% over FY2018)

    Of this, base stations was 62.4 billion yen (+51.7% over FY2018), data communication equipment was 676.5 billion yen (+5.8% over FY2018) and other network equipment was 18.7 billion yen (-24.8% over FY2018). Of data communication equipment, switching and routing equipment was 369.6 billion yen (+2.2%) and other data communication equipment (including transmission devices, communication devices and modems) was 306.9 billion yen (+10.4%). Imports related to base stations for the development of mobile phone infrastructure increased significantly.

  3. Parts (both wireline and wireless) 199.5 billion yen (-10.3% over FY2018)

(2) Detailed trends by region

A breakdown of results for FY2019 by region shows that Asia was 2,413.1 billion yen (-10.2% over FY2018), of which China was 1,901.9 billion yen (-13.3% over FY2018). North America was 68.6 billion yen (-0.3% over FY2018), of which the U.S. accounted for 64.8 billion yen (+1.1%). Europe was 50.3 billion yen (-6.9% over FY2018), of which the EU was 49.1 billion yen (-7.5% over FY2018). Asia accounted for almost all imports related to base stations, which doubled year over year.

(3) Comparison and breakdown by regions

First:Asia93.6% (+0.6% over FY2018)
Second:North America2.7% (+0.3% over FY2018)
Third:Europe1.9% (±0 % over FY2018)
Other regions1.8% (+0.3% over FY2018)

VI. Trends in Orders Received and Shipped

(1) FY2019 actual

CIAJ statistics for total orders received and shipped in FY2019 amounted to 1,501.1 billion yen, down 4.8% over FY2018. Of this, the total value of domestic shipments was 1,208.7 billion yen, a decrease of 2.9% over FY2018. The total value of exports was 292.3 billion yen, a fall of 12.0% over FY2018.

Domestic shipments decreased year over year due to a significant fall in shipments of mobile terminal equipment, despite a rise in shipments of other equipment.

*CIAJ statistics for total orders received and shipped = orders received and shipped by CIAJ member companies.
(=value of shipments for the domestic market (domestic production + foreign production) + value of exports = value of domestic production + value of imports of products produced abroad)

(2) Trend by categories

Actual domestic shipments and exports by category for FY2019 were as follows:

  1. Wireline terminal equipment

    532.0 billion yen (-3.6% over FY2018).
    Domestic demand for IP telephone sets in response to the transition to IP, intercoms, and video intercoms was strong. However, exports of office-use facsimiles (including multi-functioning devices) fell significantly due to the slowdown in the world economy. Overall results of wireline terminal equipment declined year over year.

  2. Mobile terminal equipment

    453.4 billion yen (-16.6% over FY2018)
    Although exports of other mobile terminal equipment were favorable, demand for mobile phones dropped. In addition, mobile phones that sold well shifted from high-end phones to mid-range models, and the unit price fell. Results of Mobile terminal equipment thus declined.

  3. Wireline network equipment

    212.8 billion yen (+7.7% over FY2018)
    Although key telephones and PBXs declined due to sluggish capital expenditure at companies, domestic demand and exports of digital transmission equipment were strong. Domestic demand for PON (ONU/OLT) was also favorable. The overall results of wireline network equipment rose year over year.

  4. Wireless network equipment

    231.0 billion yen (+10.6% over FY2018)
    As demand for mobile telephone infrastructure equipment is rising, shipments of base station-related equipment for domestic manufacturers fell year over year. However, demand for terrestrial fixed communication equipment for government offices and the private sector and satellite fixed communication equipment for government offices increased significantly. As a result, overall results rose year over year.

  5. Other network equipment

    44.5billion yen (+7.9% over FY2018)
    Results rose year over year, reflecting strong demand for routers and LAN switches. LAN switches both for telecom companies and for other entities in the private sector rose significantly.

  6. Communication equipment parts

    27.4 billion yen (-19.9% over FY2018)

Telecommunication Equipment Production and Trade Figures for FY2019 as of QIII (October – December) of 2019 - Strong performance of mobile terminal equipment and wireline network equipment results in domestic production growth for the second consecutive quarter –

The Communication and Information Network Association of Japan (CIAJ) announces the telecommunication equipment and trade figures for October through December 2019 as follows.

I. Overview

For the period from October through December 2019, the Japanese economy showed its first negative growth in five quarters, with a real GDP growth rate of negative 7.1 percent according to the second provisional estimates published on March 9. Consumer spending plunged in reaction to the last-minute demand before the consumption tax hike. Capital investment fell among telecommunication manufacturers and manufacturers of transportation machinery and others, following weak demand for labor saving solutions to address the labor shortage and for the construction of office buildings and others. Exports remained sluggish amid the deceleration of overseas economies.

In this situation, the telecommunication equipment market saw slumping demand for smartphones. It is attributable to a wait-and-see attitude aimed at investigating what the situation will be like after revisions to the Telecommunications Business Act, reaction to last-minute demand and hesitation to make purchases before the release of fifth-generation (5G) mobile terminals. Meanwhile, domestic demand was shifting from backbone wireline network equipment to mobile phone infrastructure equipment such as base stations and routers in a move towards commercial 5G services.

(1) Domestic market trends

For the period from October through December 2019, the size of the domestic market (= value of domestic production – value of exports + value of imports, excluding parts) amounted to 820.8 billion yen, down 14.9% year-on-year. It is due mainly to the impact of the decline in total imports.
The cumulative total market size from April through December was 2,016.6 billion yen, down 7.1% year-on-year.

(2) Domestic production

Domestic production for the October-December period reached 116.5 billion yen, up 7.8% year-on-year. The two consecutive quarters of growth is the result of an increase in mobile phones produced in the country and from the strong performance of wireline network equipment. In cumulative total from April to December, the figure stood at 328.9 billion yen, up 7.0% year-on-year.

(3) Exports

Total exports for the October-December period stood at 80.2 billion yen, down 24.7% year-on-year, showing a considerable fall for the eighth consecutive quarter. Smartphone production slumped in Asian emerging economies. Accordingly, exports of parts for production continued to shrink. While overseas economies stay stagnant, exports of digital transmission equipment grew in preparation for a hike in data traffic. In total from April to December, the figure slid by 24.6% year-on-year to 237.6 billion yen.

(4) Imports

Total imports for the October-December period were 802.9 billion yen, down 17.1% year-on-year, to mark a decline for the second consecutive quarter. Weak domestic demand for smartphones led to a massive decline in imports of smartphones produced overseas by Japanese manufacturers and those manufactured by overseas manufacturers. Imports of mobile phone infrastructure equipment, such as base stations and routers, surged to replace equipment in the “other (transmission systems, communication systems, modulators and demodulators)” category, imports of which used to be on the rise. In total from April to December, the figure stood at 1,973.1 billion yen, down 9.5% year-on-year.

II. Domestic Market Trends

(Aggregated by CIAJ based on Indices of Industrial Production and Trade Statistics of Japan)

(1) Trend by category

Actual figures by category for October through December were as follows.

The size of the domestic market, including the value of imports of foreign brands, was calculated from the Current Production Statistics and the Trade Statistics of Japan in according with the following formula:
Domestic market size = value of domestic production – value of exports + value of import

  1. Terminal equipment: 592.0 billion yen (down 20.7% compared with the same quarter of the previous year)

  2. Network equipment: 228.9 billion yen (up 4.7% over the same quarter of the previous year)

III. Domestic Production

(Based on Indices of Industrial Production compiled by the Ministry of Economics, Trade and Industry)

(1) Trend by category

Actual figures by category for October through December were as follows.

  1. Wireline terminal equipment

    Domestic production in this category amounted to 12.4 billion yen, down 10.0% year-on-year, to which fixed telephone sets contributed 0.5 billion yen, down 40.6% year-on-year, key telephones 3.4 billion yen, down 14.1% year-on-year, and intercoms 8.5 billion yen, down 0.6% year-on-year. The downward trends of equipment for home use and for business use followed the weakness in consumer spending and in corporate capital investment.

  2. Mobile terminal equipment

    Domestic production in this category was 41.2 billion yen, up 41.3% year-on-year. Among others, that of mobile phones, including public-use PHS handsets, soared 60.9% year-on-year to 25.7 billion yen. Mobile phones, wireless systems for business use and other ground mobile communication equipment produced in Japan grew at the same rate.

  3. Wireline network equipment

    Domestic production in this category amounted to 34.3 billion yen, up 15.1% year-on-year, to which central office switching systems contributed 2.9 billion yen, up 65.9% year-on-year, private branch exchanges (PBXs) 1.2 billion yen, down 38.4% year-on-year, digital transmission equipment 12.0 billion yen, up 23.5% year-on-year, and other transmission equipment 16.2 billion yen, up 11.8% year-on-year. Among the central office switching systems, demand increased for conversion systems, which are essential to transition from the public switched telephone network (PSTN) to the Internet protocol (IP) network. Production of PBXs is on the decrease due to integration and abolition of corporate bases and a decrease in lines following fixed-mobile convergence (FMC). As for digital transmission equipment, domestic production and exports continued to rise on the basis of investments by telecommunication carriers in metropolitan area networks in response to growing data traffic.

  4. Wireless network equipment

    Domestic production in this category stood at 12.8 billion yen, down 29.8% year-on-year, to which fixed telecommunication devices contributed 6.5 billion yen, down 24.8% year-on-year, and base station equipment 6.3 billion yen, down 34.3% year-on-year. Demand is climbing for stationary satellite communication systems for governmental usages. Domestic demand for mobile phone infrastructure equipment started to expand in preparation for commercial 5G services, but domestic production was weak since overseas manufacturers had significant advantages.

  5. Network connection equipment

    Domestic production in this category was 9.2 billion yen, down 5.1% year-on-year. Demand used to be on the increase for the purposes of system enhancement for commercial 5G services, rising data traffic due to video distribution services, and improvement of working environments amid work style reforms. However, it tumbled after consumer sentiment deteriorated due to the tax increase.

  6. Wireline parts (including relay equipment for wireline systems)

    Domestic production in this category stood at 6.6 billion yen, down 10.9% year-on-year. A decrease in exports of parts for smartphone manufacturing in emerging economies kept production of parts on the decrease.

IV. Export

(Compiled by CIAJ, based on based on Ministry of Finance’s “Trade Statistics”)

(1) Trend by category

Actual figures by category from October through December were as follows.

  1. Telephone sets and terminal equipment: 5.7 billion yen (down 39.1% compared to the same quarter of the previous year)

    The above figure includes mobile phones worth 4.9 billion yen, down 43.5% year-on-year, cordless handsets for landline phones worth 0.07 billion yen, up 19.7% year-on-year, and others worth 0.7 billion yen, up 25.8% year-on-year. Mobile phone exports to the United States had been falling since the second quarter of FY2019.

  2. Network equipment: 33.6 billion yen (down 0.5% compared to the same quarter of the previous year)

    The above figure includes base stations worth 0.8 billion yen, down 33.5% year-on-year, data communication equipment worth 32.0 billion yen, up 1.1% year-on-year, and other network equipment worth 0.8 billion yen, down 13.2% year-on-year. Demand for data communication equipment continued to shrink amid slumping overseas economies whereas digital transmission equipment enjoyed strong demand. As a result, total exports in data communication equipment surged.

  3. Parts (for wireline and wireless equipment): 40.9 billion yen (down 35.5% compared to the same quarter of the previous year)

    In China, smartphone production peaked out. The ratio of exports of parts to that country to total parts exports was then 30% or less while it exceeded 60% around 2016. This had a huge impact on the continued decline in exports of parts.

(2) Trend by region of destination

For the period from October through December, exports to Asia amounted to 46.1 billion yen, down 33.2% year-on-year, including those to China worth 15.1 billion yen, down 56.0% year-on-year. Exports to North America were 18.5 billion yen, down 22.7% year-on-year, including those to United States standing at 18.2 billion yen, down 22.6% year-on-year. Exports to Europe reached 11.2 billion yen, up 14.4% year-on-year, including those to the European Union amounting to 8.5 billion yen, up 0.1% year-on-year. The share of exports to China in the total exports further dropped to 18.8% for reason of trade issues and the stagnant smartphone demand.

The percentage of exports to China in total exports decreased further to 21.1% due to trade issues and a slowdown in growth in demand for smartphones.

(3) Share by region of destination

First:Asia57.4% (down 7.3 percentage points compared to the same quarter of the previous year)
Second:North America23.1% (up 0.6 percentage points over the same quarter of the previous year)
Third:Europe14.0% (up 4.8 percentage points over the same quarter of the previous year)
Rest of the world5.5% (up 1.9 percentage points over the same quarter of the previous year)

V. Imports

(Compiled by CIAJ, based on based on Ministry of Finance’s “Trade Statistics”)

(1) Trend by category

Actual figures by category from October through December were as follows.

  1. Telephone sets and terminal equipment: 544.1 billion yen (down 23.6% compared to the same quarter of the previous year)

    The above figure includes mobile phones worth 541.3 billion yen, down 23.7% year-on-year, cordless handsets for landline phones worth 1.2 billion yen, down 9.9% year-on-year, and others worth 1.6 billion yen, down 8.3% year-on-year. Slowdown in domestic smartphone demand led to a massive decline in imports of smartphones produced overseas by Japanese manufacturers and of those from overseas manufacturers.

  2. Network equipment: 206.2 billion yen (up 5.9% over the same quarter of the previous year)

    The above figure includes base stations worth 19.1 billion yen, up 33.9% year-on-year, data communication equipment worth 182.0 billion yen, up 4.8% year-on-year, and other network equipment worth 5.1 billion yen, down 24.2% year-on-year. In preparation for commercial 5G services in Japan, imports of base stations, switching and routing systems in the category of data communication equipment and other mobile phone infrastructure equipment increased.

  3. Parts (for wireline and wireless equipment): 52.7 billion yen (down 13.4% compared to the same quarter of the previous year)

(2) Trend by region of origin

For the period from October through December, imports from Asia amounted to 762.6 billion yen, down 17.4% year-on-year, including those from China of 618.3 billion, down 19.0% year-on-year. Imports from North America stood at 15.7 billion yen, down 17.2% year-on-year, including those from the United States worth 14.5 billion yen, down 17.7% year-on-year. Imports from Europe were 14.4 billion yen, up 8.6% year-on-year, including those from the European Union amounting to 14.2 billion yen, up 9.7% year-on-year.

Imports of base stations increased from Asia and from Europe.

(3) Share by region of origin

First:Asia95.0% (down 0.4 percentage points compared to the same quarter of the previous year)
Second:North America2.0% (unchanged from the same quarter of the previous year)
Third:Europe1.8% (up 0.4 percentage points over the same quarter of the previous year)
Rest of the world1.3% (unchanged from the same quarter of the previous year)

VI. Trends in Orders Received and Shipped

(1) Actual figures for QIII

According to the CIAJ independent statistics, orders received and shipped from October through December totaled 362.3 billion yen, down 6.4% from the same period a year earlier. They comprised domestic shipments of 285.4 billion yen, down 4.9% year-on-year and exports of 76.9 billion yen, down 11.3% year-on-year.
Orders received and shipped from April through December totaled 1,115.0 billion yen, down 0.3% year-on-year, comprising domestic shipments of 884.0 billion yen, up 3.4% year-on-year and exports of 231.0 billion yen, down 12.3% year-on-year.

*Orders received and shipped according the CIAJ independent statistics represent the amount of orders received and shipped by domestic manufacturers with CIAJ memberships.
(= domestic shipments (domestic production + overseas production) + exports = domestic production + imports from overseas production.)

(2) Trend by category

Actual figures by category from October through December were as follows.

  1. Wireline terminal equipment: 129.2 billion yen (down 3.7% compared to the same quarter of the previous year)

    Despite strong domestic demand for telephone sets, cordless handsets for landline phones and intercoms, a decline in exports of office-use facsimiles, including multi-functioning devices for office use) after the slowdown of overseas economies had a greater impact. Orders received and shipped in this whole category dropped from the same period a year earlier.

  2. Mobile terminal equipment: 127.1 (down 10.8% compared to the same quarter of the previous year)

    The decrease of this figure is due to a shrinkage in mobile phone shipment quantity mainly due to the revision to the Telecommunications Business Act and to a drop in unit terminal prices amid consumers’ shift from high-end to mid-range models, despite brisk domestic demand and exports for other mobile terminal equipment including business radios.

  3. Wireline network equipment: 49.5 billion yen (up 7.5% over the same quarter of the previous year)

    Orders received and shipped remained almost flat in Japan with regard to key telephones and electronic PBXs. Both domestic demand and exports of digital transmission equipment were bullish. Passive optical network (PON) devices, such as optical network units and optical line terminals, enjoyed high domestic demand. The figure for this whole category attained a year-over-year rise.

  4. Wireless network equipment: 39.9 billion yen (down 13.2% compared to the same quarter of the previous year)

    While demand considerably grew for stationary satellite communication systems for governmental usages, that for base stations and stationary ground communication systems was weak. The figure for the entire category fell from the same period of the preceding year.

  5. Other network equipment: 9.9 billion yen (up 3.7% over the same quarter of the previous year)

    The year-on-year growth in this figure was the result of brisk demand for routers and LAN switches.

  6. Communication equipment parts: 6.7 billion yen (down 22.2% compared to the same quarter of the previous year)

VII. Domestic Production, Imports and Exports for Calendar Year 2019

(1) Domestic market trend for calendar year 2019

The size of the domestic market stood at 2,714.8 million yen for the period from January through December 2019, down 7.0% from the previous year. Main factors that led to the decline include a huge slide in mobile phone demand following the terminal purchase guidelines and a trend similar to that in 2016, in which there was a conservative attitude towards capital investment amid the yen appreciation.

(2) Domestic production for calendar year 2019

Domestic production from January to December 2019 stood at 450.6 billion yen, down 1.4% from the previous year. Domestic production of wireline network equipment, such as digital transmission equipment and switching systems, and network equipment including routers and LAN switches showed a year-over-year hike due to bullish demand for them. Domestic demand for intercoms and marine and aeronautical radio communication equipment also grew year-on-year. Meanwhile, weak domestic production was recorded for wireless network equipment for commercial 5G services.

(3) Exports for calendar year 2019

Exports from January through December 2019 stood at 319.9 billion yen, down 25.2% from the previous year. Mobile phone exports attained a year-on-year surge, as they showed an upward trend until the first half of 2019. However, exports of most products tumbled from the preceding year. Among others, exports of parts plunged significantly as a result of a slump in overseas economies.

(4) Imports for calendar year 2019

Imports for January through December 2019 stood at 2,645.7 billion yen, down 8.6% from the previous year. Whereas imports of data communication equipment and base stations grew from the previous year amid brisk demand for digital transmission equipment and others, imports of mobile phones, which account for a large proportion of the total imports, dropped considerably from the preceding year due to stagnating domestic demand.

"FY2019 – FY2024 Mid-Term Demand Forecast for Telecommunication Equipment" Advances in 5G expected to create new devices and services, with gradual growth in telecom equipment demand

The Communications and Information network Association of Japan (CIAJ), a general incorporated association, released its “Mid-Term Demand Forecast for Telecommunication Equipment,” covering FY2019 through FY2024. CIAJ has released this forecast since 1960 and the 2019 edition marks its 60th release. To commemorate this milestone, CIAJ released a special edition focusing on the 5th generation mobile communication system (5G). The demand forecast looks at new demand for telecom equipment and network equipment related to 5G as well as trends in new technology driven services.

I. Outline

Looking at the Japanese economy in FY2018, foreign demand was impacted by the overall slowdown of global economies, especially in China, and exports of IT related equipment to Asia indicated a decline from the beginning of FY2018. On the other hand, the shortage of workers and aging equipment led to an increase in capital investment in facilities. Together with healthy corporate earnings and rising incomes and consumer spending, they led to healthy domestic demand figures. On a more granular level, the telecom equipment market was helped by the robust domestic demand for wireline terminal equipment and wireline network equipment also showed signs of positive growth in order to accommodate growth in network data traffic. However, the large bulk of this demand (in yen value) is dependent on mobile phone and radio infrastructure equipment, which is dropping as the society makes the switch to 5G. Combined with the global economic slowdown and most categories indicating declines in export figures, the demand for telecom equipment in FY2018 was 3.451 trillion yen (-5.1% year-over-year growth over FY2017).

The Japanese economy in FY2019 is showing a small increase of real GDP for July to September which is expected to be 0.2% (preliminary figures announced Nov. 14, 2019). Demand growth in infrastructure construction, investments to streamline and improved energy efficiency are forecast, but consumer spending is expected to remain low, leading to a gradual slowdown in domestic demand. On the other hand, semi-conductors and 5G-related exports are rebounding, and foreign demand for ICT is forecast to recover. The telecom equipment market in particular, can expect growth in wireline network equipment with the launch of 5G, but demand for mobile phones continues to decline with the revision in the Telecommunications Business Act and the rise in consumption tax. Together with slow investments in radio infrastructure equipment, total demand for FY2019 is forecast to hit bottom, while remaining low at 3.384 trillion yen (-1.9% year-over-year growth).

For FY2020 onwards, the ICT industry and advances in the technology is expected to contribute to Japan’s economic growth and provide solutions to social challenges with the realization of Society 5.0 and more specifically new 5G features, including vehicles being increasingly equipped with electronic devices as the industry moves towards autonomous cars and the increasing acceptance of robots and artificial intelligence (AI) to augment the global shortage of labor. The total market value is expected to grow gradually, forecast to reach 3.793 trillion yen in FY2024, or an increase of 9.9% over the FY2018 figure with new demand for communication terminal equipment and communication network equipment, with both securing their position as part of the social infrastructure.

II. Special section on 5G

Pre-commercial 5G service was launched in Japan from September, 2019, with commercial launch to follow shortly afterwards. In addition to the enhancement and expansion of the network environment, businesses are seeking new innovations and business opportunities. In the special section on 5G, CIAJ analyzed its potential and how it is changing the telecom market by focusing on its features and scope of impact across industries.

(1) Features of 5G and its progress in Japan

  • There are 3 outstanding features of 5G (high speed & high capacity, high-density connections, low latency) which meet the unique needs of diverse industries – such as manufacturing, logistics, emergency/disaster prevention, transportation, and healthcare – and create new use cases. For example, high speed, large volume capacity will allow transmission of 3D image and xR services. Simultaneous connectivity of many devices will play a role in smart cities and smart homes, and low latency will be essential in factory automation and autonomous driving.
  • As of the fall of 2019, a global standard concerning 5G high speed/ high capacity had been determined, and commercial service based on non-standalone (NSA) 5G base stations using 4G-based controls had begun. However, standardization concerning high-density connections and low latency is still in the works and furthermore, they require all radio network facilities to use 5G based standalone (SA) base stations. Therefore, full-spec commercial services with multiple 5G-unique features, including high-density connections and low latency is still several years down the road.
  • The four telecom carriers were planning to invest 1.7 trillion yen to put about 70,000 5G base stations in place by the end of FY2024 in accordance to the operational plans for the placement of specified frequency base stations of April 2019. However, capital investment in hardware is expected to be of smaller scale than in 4G, due in part because software upgrades to existing 4G base stations would be sufficient (software-defined networks: SDNs), and virtualization of the overall radio network using run-of-the-mill hardware can realize low-priced small networks. NTT Docomo is aggressively placing SDN-compatible 4G base stations, while Rakuten Mobile is pursuing completely virtualized technologies, leading to the CIAJ projection that 5G base station investments will be less than for 4G.

(2) 5G market trends

  • In the consumer market, the focus is on smart homes and autonomous driving. In smart homes, the use of IoT (Internet of things) to monitor what is happening inside as well as outside the home and using AI to decipher behavioral patterns to support everyday life would require 5G network infrastructure to connect various devices and appliances. Autonomous driving would require an always-connected state and transactions of massive volumes of data, including from numerous on-board sensors, information on other vehicles operating within close vicinity, road/traffic information stored in servers and more. This would all take advantage of the high speed, high capacity and low latency characteristics of 5G.
  • In the enterprise market, much of the attention is on local 5G. Catering to regional and specific industry needs, local businesses or municipal governments have the flexibility of building networks within their properties or buildings. CIAJ forecasts market growth based on this potential. Advances in local 5G could not only replace existing carrier or private communication networks in fields such as emergency/disaster prevention systems, but create new businesses, such as smart factories, remote operations (heavy equipment, drones, robots, etc.) and security/surveillance. A further possibility is existing enterprise equipment, like PBXs, becoming local 5G compatible.
  • In the infrastructure and Internet markets, the focus is on equipment for that facilitates the move towards open and virtualized mobile networks. Domestic manufacturers are expected to see market growth with the implementation of open network technologies, such as O-RAN (Open Radio Access Network) on existing 5G base station networks and the laying down of 5G backhaul, which takes advantage of digital transmission equipment and fixed radio equipment (historically strong areas for domestic manufacturers), and using traffic lights as 5G base stations.

III. 2019 Forecast

The total telecommunication equipment market figure for FY2019 is forecast at approximately 3.384 trillion yen (-1.9% year-over-year growth), with the domestic market accounting for 3.056 trillion yen (-1.1% year-over-year growth), and exports accounting for 327.7 billion yen (-8.8% year-over-year growth).

Major Equipment Categories Expected to Increase Over FY2018 (in descending order)
FY2019
(expected)
(billion yen)
Increase over
FY2018
(billion yen)
Growth rate
Digital transmission equipment202.273.256.8%
Fixed communication equipment159.026.820.3%
Base station equipment221.221.710.9%
LAN switches176.64.32.5%
Optical access equipment20.60.84.0%

(1) Consumer equipment total: 1.881 trillion yen (-7.1% year-over-year growth)

  • The replacement cycle of mobile terminals continues to become longer along with decreasing demand, impacted by such factors as the revision of the Telecommunication Business Act and increase in consumer tax rate.
  • Niche demand among older adults for cordless phones and personal facsimiles is expected as a measure to deal with unwanted telemarketing calls or calls from scam artists, but it will not be enough to reverse the overall downward trend.

(2) Enterprise equipment total: 445.2 billion yen (-9.0% year-over-year growth)

  • Replacements are central to demand for key telephones, PBXs and office-use cordless phones. Despite the construction rush to build accommodations for inbound tourists and facilities for older adults, the total domestic demand is forecast to show a gradual decline.
  • Overseas demand takes up a large share for office-use facsimiles (including multi-functioning facsimiles) and with the slowing down of overseas economies expected to continue, it will have a significant impact on exports.

(3) Infrastructure equipment total: 583.7 billion yen (+26.0% year-over-year growth)

  • Increased placement of base stations in preparation of 5G commercial services, as well as demand for digital transmission equipment and fixed communication equipment for their use as 5G small cell back haul systems.
  • Demand for fixed radio equipment as part of disaster/emergency systems and BCP measures is projected.

(4) Internet equipment total: 288.5 billion yen (+1.6% year-over-year growth)

  • Healthy replacement demand is projected for routers, LAN switches and optical access equipment, which are integral to 5G/IoT and cloud services, and is expected to result in a slight overall growth for the entire category.

(5) Equipment/parts categories not included above: 185.8 billion yen (-1.9% year-over-year growth)

IV. Midterm Projection

The FY2024 total figure is projected at 3.793 trillion yen (+9.9% growth over FY2018), with the domestic market accounting for 3.463 trillion yen (+12.0% growth over FY2018) and exports accounting for 330.6 billion yen (-8.0% growth over FY2018).

Major Equipment Categories Expected to Increase Over FY2018 (in descending order)
FY2024
(expected)
(billion yen)
Increase over
FY2018
(billion yen)
Growth rate
Mobile communication terminals
(public network use)
2178.2199.110.1%
Base station equipment329.8130.265.3%
Fixed communications equipment179.747.435.9%
Digital transmission equipment172.944.034.1%
LAN switches188.015.79.1%
Optical access equipment21.51.88.9%

(1) Consumer equipment total 2.213 trillion yen (+9.3% over FY2018)

  • The global mobile phone market (includes smartphones) sales revenue in FY2023 is projected at 438.0 billion U.S. dollars (CAGR 4.7% over FY2018) with the launch of commercial 5G services. However, as 5G handsets overtakes 4G phones and the 5G handset market reaches maturity, demand is expected to diminish from FY2022 (Diagram 1).
  • The domestic demand for mobile communication terminals is forecast to show gradual growth as carriers implement strategies to promote 5G commercial services and new contents appear on the market.
  • Although the development of new technologies geared to accommodate market needs will sustain existing users, overall demand for cordless phones and personal facsimiles is forecast to continue declining with fewer use cases and more consumers opting not to own wireline phones.
  • Official two-way radios, which is growing as disaster prevention/emergency measures are strengthened, and intercoms, which increase along with implementation of security measures, are included in the “Other equipment” category.

(2) Enterprise equipment total: 427.8 billion yen (-12.6% over FY2018)

  • In key telephones, PBXs and office-use cordless phones, the shift to large capacity and software-defined systems, migration to alternative services, such as the cloud and FMC will all play a part in the continuing decline of the market.
  • Despite steady replacement demand, the domestic market for office-use facsimiles will continue to decline slowly, as office space efficiency is sought, leading to fewer devices per office, as well as potential trade conflicts impacting exports and fierce price wars with foreign brands.

(3) Infrastructure equipment total: 683.9 billion yen (+47.7% over FY2018)

  • While the launch of commercial 5G services will lead to a spike in demand for base stations and terrestrial fixed communication devices to be used for back haul systems, demand for digital transmission equipment for wireline networks to accommodate the surge in network traffic is expected to reach the end of its implementation cycle.
  • Public sector demand for satellite fixed communication equipment will remain steady with planned satellite launches.
  • Capital investments in central office switching systems has ended and is in the maintenance/parts replacement phase, but from FY2020 onwards, gradual rise in investment in IP-conversion devices for subscriber switching equipment is expected.

(4) Internet equipment total: 299.1 billion yen (+5.4% over FY2018)

  • Growth in demand for routers from global carriers is expected as they switch to high-speed versions to handle the surge in traffic and 5G needs. On the other hand, the market for LAN switches will decline with virtualization.
  • While demand for routers targeting enterprise-use is forecast to grow among emerging markets, its commoditization will push prices down and overall market value will remain flat. Increase in PoE use and cloud services will stimulate demand for high-speed interface LAN switches for data centers.
  • Large investments are not expected in the domestic carrier and enterprise router market,. Demand will be concentrated in upgrades to take advantage of high-speed/large capacity and advanced features, such as quality control and security. However, projected decline in unit prices resulted in the forecast of a slight drop in overall market value.
  • In the domestic carrier and enterprise LAN switch market, the embracing of IoT/M2M technologies will result in massive increases in the number of devices connected to the network, meaning a surge in network traffic, and investments will be seen in carrier facilities and data centers. Commercial 5G services will also translate into additional facilities and replacement demand, so that the overall value of the market is forecast to increase.
  • Demand for high-speed fixed lines (10 Gbps optical services, etc.), mobile data offloading and spread of CATV optical broadcasting services are expected to influence the market for optical access equipment. However, the drop in unit price per port and virtualization technologies negatively impacting demand for dedicated equipment (routers and LAN switches) will most likely reign in growth of the total market value.

(5) Equipment/parts categories not included above: 169.8 billion yen (-10.4% year-over-year growth)

Forecasting methodology

Domestic market forecasts are based on statistics compiled by CIAJ and interviews with CIAJ members, with the cooperation of InfoCom Research, Incorporated, for areas not covered by CIAJ.

Global ICT market forecasts and demand trends refer to and utilize data and analysis provided by a global research company IHS Markit with the cooperation of InfoCom Research, Incorporated.

Please click here to purchase a copy of the CIAJ Mid-Term Demand Forecast for Telecommunication Equipment (2019 – 2024) (6,000 yen + tax for CIAJ members, 19,000 yen + tax for non-CIAJ members). The CIAJ Mid-Term Demand Forecast for Telecommunication Equipment is available in Japanese only.

Telecommunication Equipment Production and Trade Figures For the First Half of FY2019 (April – September) -Growth in domestic production boosted by strong sales of wired systems –

The Communications and Information network Association of Japan (CIAJ: a general incorporated association) announces the telecommunication equipment production and trade figures for April through September, 2019 as follows.

I. Summary

The Japanese economy maintained the fourth consecutive quarter of growth, with an annual GDP growth rate of 1.8% (second preliminary report: December 9) in April through September 2019. While foreign demand continues to decline primarily due to the slowdown in overseas economies, the Japanese economy is supported by domestic demand, including an increase in consumer spending from a last-minute surge in demand before the consumption tax hike, capital expenditure and public investment.

In this economy, demand for mobile phones in the communication equipment market has been decreasing mainly due to restrained purchasing before the revision of the Telecommunications Business Act. Investment in the wireless system infrastructure is also at a low level due to the current transition to the fifth generation of mobile communications systems (5G). Meanwhile, in preparation for an increase in data traffic due to 5G commercial services and 4K/8K video distribution, demand increased for equipment related to wired system networks, the backbone.

(1) Domestic Market Trends

The domestic market value (domestic production value – export value + import value, excluding parts) amounted to 1,195.8 billion yen in the April through September period, a year-on-year decrease of 0.8%. The decrease was caused in part by a fall in total imports.

(2) Domestic production

Domestic production totaled 212.4 billion yen in April through September, a year-on-year increase of 6.5%. It was the first increase after 14 half-year periods since the first half of FY2012, thanks to growth in the domestic production of mobile phones and strong sales of equipment related to wired networks.

(3) Exports

Total exports amounted to 157.3 billion yen for April through September, which was a significant year-on-year fall of 24.5% and a continuation of the decline. Smartphone shipment in emerging countries in Asia stopped climbing and export of components for smartphone production has been sharply declining. In addition, overseas capital expenditure continues to fall due in part to trade issues, which decreased in three consecutive half-year periods.

(4) Imports

In the April through September period, total imports amounted to 1,170.2 billion yen after decreasing 3.4% year on year. While “other (transmission devices, communication devices, modems, etc.)” among data communication equipment increased due to strong wired network-related domestic demand, total imports decreased for two consecutive half-year periods as a result of a fall in mobile phones, comprising a large part of total imports, partly due to restrained purchasing.

II. Domestic market trends

(Aggregated by CIAJ based on Indices of Industrial Production and Trade Statistics of Japan)

(1) Detailed trends by categories

Actual figures by category for FY2019 first half (H1) are as follows:

The size of the domestic market has been calculated based on production statistics and trade statistics, assuming that it is the result of subtracting export value from domestic production added with import value (including import value of overseas manufacturers).

  1. Terminal equipment
    788.7 billion yen (-6.4% over the same period of the previous year)

  2. Network equipment
    407.1 billion yen (+12.2% over the same period of the previous year)

III. Trends in domestic production

(Aggregated by CIAJ based on Indices of Industrial Production compiled by the Ministry of Economics, Trade and Industry)

(1) Detailed trends by categories

Actual figures by category for FY2019 H1 are as follows:

  1. Wired terminal equipment

    25.8 billion yen (+0.0% over the same period of the previous year)
    This includes 1.3 billion yen for telephones (-22.2% over the same period of the previous year), 7.2 billion yen for push-button telephones (-10.9% over the same period of the previous year) and 17.3 billion yen for intercoms (+12.9% over the same period of the previous year). Personal and household products such as telephones equipped with security features and video intercoms indicate a growth trend. The downward trend of push-button telephones continues due to a decline in value of landline telephones.

  2. Mobile terminal equipment

    68.6 billion yen (+11.2% over the same period of the previous year)
    This includes 44.8 billion yen for mobile phones (including PHS for the public) (+7.3% over the same period of the previous year). In contrast to the restrained purchasing of smartphones manufactured overseas, mobile phones other than smartphones, such as feature phones manufactured in Japan, increased year on year.

  3. Wired network equipment

    61.1 billion yen (up 15.6% over the same period of the previous year)
    This includes 3.8 billion yen for central offices (-5.1% over the same period of the previous year), 3.8 billion yen for private branch exchanges (+28.8% over the same period of the previous year), 21.0 billion yen for digital transmission equipment (+24.0% over the same period of the previous year), and 29.3 billion yen (+11.5 % over the same period of the previous year) for other transmission devices. Demand for the replacement of private branch exchanges grew thanks to an increase in capital expenditure of domestic companies. Domestic production of digital transmission devices continues to grow as a result of demand for backbone systems in expectation of a rapid increase in data traffic.

  4. Wireless network equipment

    25.3 billion yen (-17.6% over the same period of the previous year)
    This includes 11.8 billion yen (-0.6% over the same period of the previous year) for fixed telecommunication devices and 13.4 billion yen (-28.4% over the same period of the previous year) for base station communication equipment. While demand for disaster control/commercial wireless systems for public offices and private sector and satellite communication systems for public offices is growing, demand for base station communication systems for mobile phones is sluggish and domestic production of wireless network equipment decreased year on year.

  5. Network access equipment

    18.0 billion yen (+38.3% over the same period of the previous year)
    Demand increased for renewal related to higher speed and improved functions in response to new services such as the commercialization of 5G networks, and domestic production of network connection equipment grew year on year.

  6. Wireline parts (includes relay equipment for wireline systems)

    13.6 billion yen (-11.1% over the same period of the previous year)
    Component production continues to decrease due to a fall in the export of components for smartphones manufactured overseas.

IV. Export

(Compiled by CIAJ, based on Ministry of Finance’s “Trade Statistics”)

(1) Detailed trends by category

Actual figures by category for FY2019 H1 are as follows:

  1. Telephone sets and terminal equipment: 12.1 billion yen (-0.6% over the same period of the previous year)

    This includes 10.7 billion yen for mobile phones (+1.4% Telephone sets and terminal equipment), 0.11 billion yen for cordless phones (-39.2% Telephone sets and terminal equipment), and 1.3 billion yen for other products (-9.9% Telephone sets and terminal equipment). Mobile phones for the U.S. increased significantly for eight consecutive quarters from the second quarter of FY2017, but began to decline in the second quarter of FY2019.

  2. Network equipment: 60.0 billion yen (-4.4% over the same period of the previous year)

    This includes 1.3 billion yen for base stations (-51.7% over the same period of the previous year), 56.5 billion yen for data communication equipment (-3.0% over the same period of the previous year), and 2.2 billion yen for other network-related apparatuses (+ 23.1% over the same period of the previous year). Export of data communication equipment has been sluggish due to a fall in demand caused by a slowdown in the overseas economies.

  3. Parts (both wireline and wireless): 85.3 billion yen (-36.2% over the same period of the previous year)

    A declining trend in the export of IT products, particularly components for communication equipment, has been continuing since the beginning of FY2018.

(2) Detailed trends by region

The results by region for the April through September period include 96.2 billion yen for Asia (-33.5% over the same period of the previous year), in which exports to China totaled 33.3 billion yen (-51.7% over the same period of the previous year). Exports to North America amounted to 36.0 billion yen (-5.8% over the same period of the previous year), of which exports to the U.S. totaled 35.6 billion yen (-5.4% over the same period of the previous year). Exports to Europe totaled 19.8 billion yen (+7.7% y over the same period of the previous year), of which exports to the EU amounted to 17.1 billion yen (+6.5% over the same period of the previous year).

The percentage of exports to China in total exports decreased further to 21.1% due to trade issues and a slowdown in growth in demand for smartphones.

(3) Comparison and breakdown by regions

First:Asia61.2% (-8.2% over the same period of the previous year)
Second:North America22.9% (+4.6% over the same period of the previous year)
Third:Europe12.6% (+3.8% over the same period of the previous year)
Other regions:3.3% (-0.2% over the same period of the previous year)

V. Import

(Compiled by CIAJ, based on based on Ministry of Finance’s “Trade Statistics”)

(1) Detailed trends by categories

Actual figures by category for FY2019 H1 are as follows:

  1. Telephone sets and terminal equipment: 706.4 billion yen (-8.0% over the same period of the previous year)

    This includes 700.7 billion yen for mobile phones (-8.0% over the same period of the previous year), 2.3 billion yen for cordless phones (-13.4% over the same period of the previous year), and 3.3 billion yen for other products (+5.4% over the same period of the previous year). Import of smartphones from domestic and overseas manufacturers decreased chiefly due to restrained purchasing before the revision of the Telecommunications Business Act.

  2. Network equipment: 362.7 billion yen for (+10.2% over the same period of the previous year)

    This includes 20.3 billion yen for base stations (+2.7% over the same period of the previous year), 333.2 billion yen for data communication equipment (+12.1% over the same period of the previous year), and 9.2 billion yen for other network-related apparatuses (-23.9% over the same period of the previous year). Import of “other products (transmission devices, communication devices, modems, etc.)” in data communication equipment continued to rise and increased 30.9% year on year due to growth in demand for communication and network facilities.

  3. Parts (both wireline and wireless): 101.1 billion yen (-11.8% over the same period of the previous year)

(2) Detailed trends by region

The results by region for the April through September period include 1,087.9 billion yen from Asia (down 3.8% year on year), in which imports from China totaled 834.2 billion yen (down 7.5% year on year). Imports from North America totaled 36.1 billion yen (up 4.7% year on year), of which imports from the U.S. amounted to 34.0 billion yen (up 6.8% year on year). Imports from Europe totaled 22.7 billion yen (down 18.5% year on year), of which imports from the EU amounted to 21.9 billion yen (down 20.3% year on year).
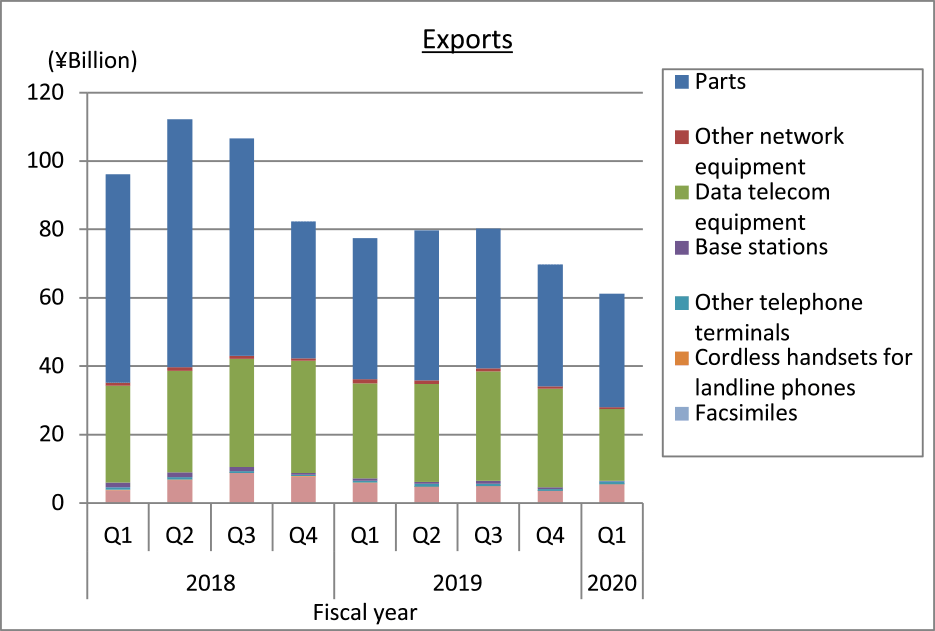
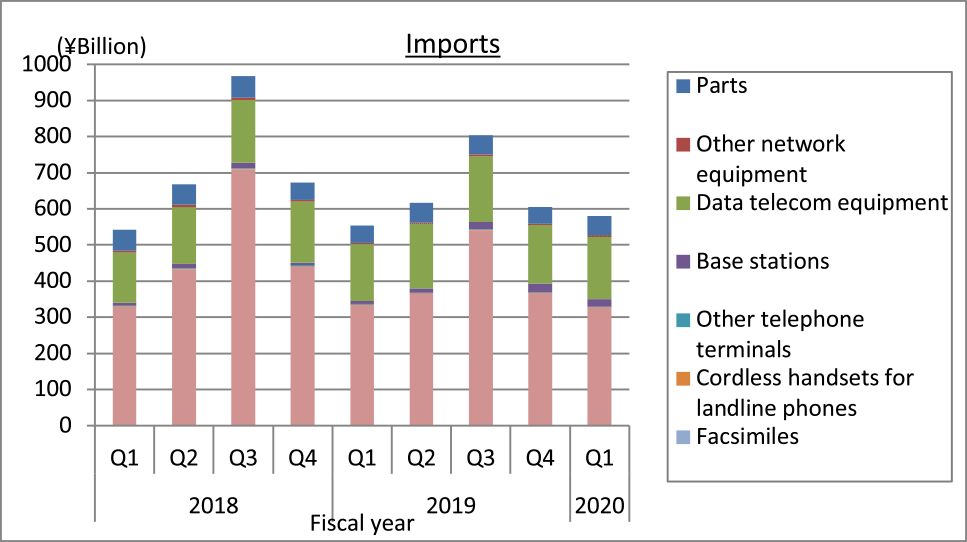
Import of “other data communication apparatuses (transmission devices, communication devices, modems, etc.)” from Asia, Europe and North America increased.

(3) Comparison and breakdown by regions

First:Asia90.3% (-0.6% over the same period of the previous year)
Second:North America3.1% (+0.3% over the same period of the previous year)
Third:Europe1.9% (-0.4% over the same period of the previous year)
Other regions:2.0% (+0.7% over the same period of the previous year)

VI. Trends in orders received and shipped

(1) FY2019 H1 actual

CIAJ statistics for total orders received and shipped in April through September amounted to 752.7 billion yen, representing an increase of 2.9% year on year. This includes 598.5 billion yen for domestic shipments, which rose by 7.8% year on year, and 154.1 billion yen for exports, which fell 12.8% year on year.

*CIAJ statistics for total orders received and shipped represent orders received and shipped by CIAJ member companies.

(The value of domestic shipments (total of domestic production and overseas production) added to the export value is the total of the domestic production value added to the import value of products manufactured overseas.)

(2) Trends by categories

Actual figures for FY2019 H1 by category are as follows:

  1. Wired terminal equipment: 270.3 billion yen (-2.4% over the same period of the previous year)

    Overall orders for wired terminal equipment received and shipped decreased year on year due to a fall in the export of personal fax machines (including multifunction personal fax machines) and business fax machines (including multifunction business fax machines) despite a steady amount of orders for cordless phones and intercoms received and shipped.

  2. Mobile terminal equipment: 214.7 billion yen (-13.9% over the same period of the previous year)

    Demand for mobile phones fell principally due to restrained purchasing. Both domestic demand for and export of other mobile terminal apparatuses (wireless systems for disaster control, commercial use, etc.) are growing.

  3. Wired network equipment: 102.6 billion yen (+18.6% over the same period of the previous year)

    Export of push-button telephones and private branch exchanges decreased despite the level of domestic orders remaining mostly unchanged. In addition, orders for wired network-related equipment as a whole increased year on year thanks to significant growth in domestic demand for and export of digital transmission devices.

  4. Wireless network equipment 129.3 billion yen (+60.2% over the same period of the previous year)

    Despite sluggish orders for communication devices used for mobile phone base stations, overall orders for wireless network-related equipment increased year on year thanks to significant growth in demand for disaster-control and commercial wireless systems for public offices and the private sector and satellite communication systems for public offices.

  5. Other network equipment: 21.5 billion yen for (+5.4% over the same period of the previous year)

    Orders for LAN switches continue to rise and increase year on year despite the unchanging level of orders for routers.

  6. Communication equipment parts: 14.2 billion yen (-21.0% over the same period of the previous year).

Telecommunication Equipment Production and Trade Figures for the First Quarter (April-June) of FY2019 – Figures were weak for reflecting the start of a changeover period for the generation of wireless telecommunication systems, and telecommunication equipment production was sluggish overall–

The Communication and Information network Association of Japan (CIAJ) announces the telecommunication equipment production and trade figures for Q1 (April-June) of FY2019 as follows.

I. Summary

In April through June 2019, the Japanese economy expanded for a third consecutive quarter, with real GDP increasing at an annual rate of 1.8%, according to preliminary estimates. As private consumption and business spending remained firm, domestic demand continued to expand. However, exports fell for a second straight quarter amid weaker foreign demand, dampened by slowdown in China, Europe and other economies and rising trade tensions.

Looking specifically at the telecom market, demand for wireless terminal equipment and network equipment fell, reflecting the start of the changeover period for the generation of wireless telecommunication systems. However, looking ahead to expansion in 4k and 8k video transmission and 5G transmission capacity, a sharp increase in data traffic is expected and demand for wireline network equipment that will form the backbone network is, therefore, starting to increase.

(1) Domestic Market Trends

The value of the domestic market (= value of domestic production – value of exports + value of imports) in April through June was 553.3 billion yen. The domestic market increased in size for the first time in three quarters, showing positive growth of 3.5% over the same quarter of the previous year. This was because the value of domestic production improved and the value of imports increased.

(2) Domestic Production

The value of domestic production in April through June was 90.1 billion yen, representing negative growth of 2.7% over the same quarter of the previous year and marking the eighth straight quarter of decline in a losing streak which began in the second quarter of FY2017. Domestic production fell year on year due to a sharp drop in production of wireless mobile terminal equipment and base station telecommunication equipment, reflecting the start of the changeover period for the generation of wireless telecommunication systems, despite increased production of wireline terminal equipment and wireline network equipment.

(3) Exports

The total value of exports in April through June was 77.5 billion yen, representing negative growth of 19.4% over the same quarter of the previous year and continuing a steak of sharp declines. Against the backdrop of economic slowdown in China and other emerging Asian economies, smartphone production decreased, and exports of parts used in the production of smartphones fell sharply. Meanwhile, foreign equipment demand also weakened amid rising trade tensions and the total value of exports fell for a sixth straight quarter.

(4) Imports

The total value of imports in April through June was 553.9 billion yen, representing positive growth of 2.1% over the same quarter of the previous year and moving into positive territory for the first time in two months. The total value of imports increased because imports of mobile phones started to recover from the general reluctance to buy in anticipation of changes to phone plans and because imports of « other data telecom equipment (transmission equipment, communications equipment, modem, etc.) » in the data telecom equipment category increased due to strong domestic demand for wireline network equipment.

II. Domestic Market Trends

(Aggregated by CIAJ based on Indices of Industrial Production and Trade Statistics of Japan)

(1) Detailed trends by categories

The size of the domestic market (including the value of imports of foreign brands) was calculated from government figures, the Indices of Industrial Production and Trade Statistics of Japan, according to the following formula:

Domestic market size = value of domestic production – value of exports + value of imports

  1. Terminal equipment
    363.5 billion yen (-0.6% over the same quarter of the previous year)

  2. Network equipment
    188.0 billion yen (+12.8% over the same quarter of the previous year)

Table: Domestic Market (by categories/quarter)

III. Domestic Production

(Aggregated by CIAJ based on Indices of Industrial Production compiled by the Ministry of Economics, Trade and Industry)

(1) Detailed trends by categories

  1. Wireline terminal equipment

    12.2 billion yen (+6.5% over the same quarter of the previous year). Of which, telephone sets was 0.8 billion yen (+13.2% over the same quarter of the previous year), key telephones was 3.6 billion yen (+2.7% over the same quarter of the previous year), and intercoms was 7.8 billion yen (+13.0% over the same quarter of the previous year). Categories that meet personal and household security needs are in an upward trend. Production of key telephones still tends to remain flat in Japan as the downward trend caused by the decline in value of fixed line telephones is partially offset by positive factors such as usage as BCP measures, increased functionality and last-minute demand ahead of the consumption tax hike.

  2. Mobile terminal equipment

    22.4 billion yen (-22.3% over the same quarter of the previous year). Of which, mobile phones (including public-use PHS) was 15.8 billion yen (-22.9% over the same quarter of the previous year). Production of mobile phones recorded the eighth straight quarter of decline in a losing streak which began in the second quarter of FY2017, reflecting lengthening of the replacement cycle due to the increased device cost and the continued shift to offshore production.
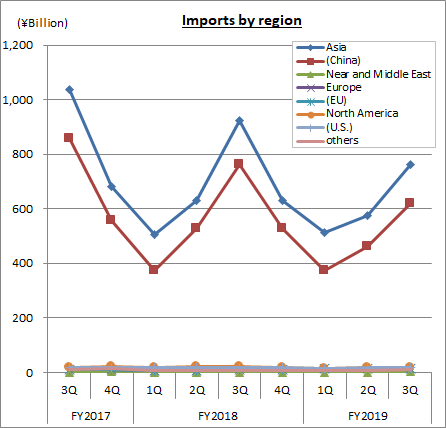
  3. Wireline network equipment

    28.1 billion yen (+10.9% over the same quarter of the previous year). Of which, central office switching systems was 1.6 billion yen (-15.4% over the same quarter of the previous year), PBXs was 2.0 billion yen (+59.9% over the same quarter of the previous year), digital transmission equipment was 8.7 billion yen (+6.4% over the same quarter of the previous year) and other transmission equipment was 14.5 billion yen (+12.6% over the same quarter of the previous year). For PBXs, replacement demand was robust due to strong business spending but exports decreased amid the slowdown of foreign economies. Domestic production of digital transmission equipment continued to expand due to increased demand for wireline network equipment such as backbone systems in anticipation of an increase in data traffic.
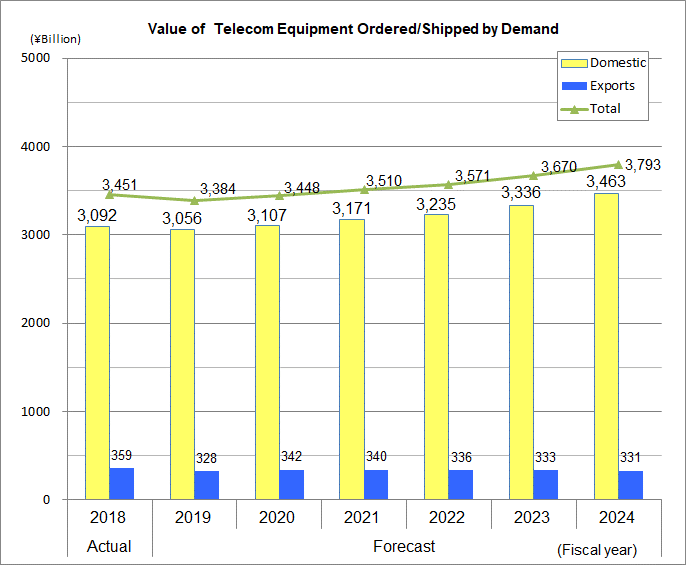
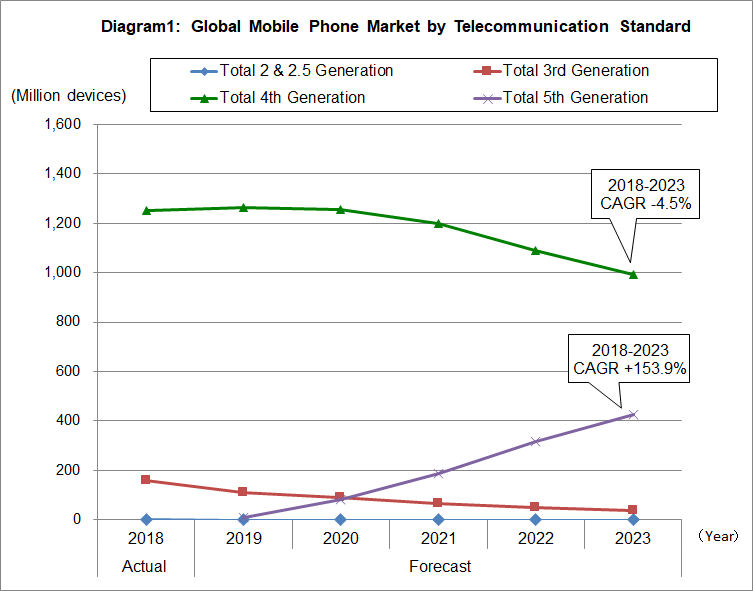
  4. Wireless network equipment

    12.2 billion yen (-12.6% over the same quarter of the previous year). Of which, fixed telecommunication devices was 5.9 billion yen (+12.3% over the same quarter of the previous year) and base station equipment was 6.3 billion yen (-27.6% over the same quarter of the previous year). Total production of wireless network equipment was below the level a year earlier due to decline in base station communication equipment for mobile networks, which outweighed growth in domestic production of emergency/ MCA radio base stations for government, microwave communication equipment for the private sector and satellite communication equipment for government.

  5. Network access equipment

    8.3 billion yen (+55.6% over the same quarter of the previous year). Total domestic production of network access equipment was above the year-ago level due to growth in demand spurred by the replacement of existing devices for cloud computing, IoT and 5G, and IT investment to strengthen security.

  6. Wireline parts (includes relay equipment for wireline systems)

    6.9 billion yen (-9.7% over the same quarter of the previous year). Production of parts continued to fall due to decline in overseas demand for parts used in the production of smartphones.

IV. Exports

(Compiled by CIAJ, based on Ministry of Finance’s “Trade Statistics”)

(1) Detailed trends by category

Actual figures for April through June by category are as follows (the facsimile category is no longer indicated from January 2018):

  1. Telephone sets and terminal equipment 6.5 billion yen (+40.6% over the same quarter of the previous year)

    Of which, mobile phones was 5.9 billion yen (+56.0% over the same quarter of the previous year), cordless handsets for landline phones was 60 million yen (-56.1% over the same quarter of the previous year), and other was 600 million yen (-22.5% over the same quarter of the previous year). Exports of mobile phones to the U.S. increased sharply for the eighth straight quarter in a winning streak which began in the second quarter of FY2017.

  2. Network equipment 29.7 billion yen (-3.0% over the same quarter of the previous year)

    Of which, base stations was 700 million yen (-44.8% over the same quarter of the previous year), data communication equipment was 27.8 billion yen (-2.3% over the same quarter of the previous year) and other network equipment was 1.2 billion yen (-42.4% over the same quarter of the previous year). Exports of data communication equipment declined due to a dip in demand caused by the downturn of overseas economies.

  3. Parts (both wireline and wireless) 41.4 billion yen (-32.2% over the same quarter of the previous year)

    The decline is largely attributable to decreased exports of parts used in the production of smartphones amid reduced production of smartphones in China and other parts of Asia.

(2) Detailed trends by region

A breakdown of results for April through June by region shows that Asia was 45.1 billion yen (-31.5% over the same quarter of the previous year), of which China was 14.4 billion yen (-52.6% over the same quarter of the previous year). North America was 19.1 billion yen (+10.9% over the same quarter of the previous year), of which the U.S. was 18.9 billion yen (+11.5% over the same quarter of the previous year). Europe was 10.4 billion yen (+8.0% over the same quarter of the previous year), of which the EU was 9.1 billion yen (+7.3% over the same quarter of the previous year).

Given that the percentage of total parts exports accounted for by exports to China fell further to 28.1%, production of smartphones, etc., is shifting away from China to other parts of Asia.

(3) Comparison and breakdown by regions

First:Asia58.2%      (-10.4% over the same quarter of the previous year)
Second:North America26.6%      (+8.7% over the same quarter of the previous year)
Third:Europe13.3%      (+3.3% over the same quarter of the previous year)
Other regions:1.9%        (-1.7% over the same quarter of the previous year)

V. Imports

(Compiled by CIAJ, based on based on Ministry of Finance’s ‘Trade Statistics”)

(1) Detailed trends by category

Actual figures by category for April through June are as follows (the facsimile category is no longer indicated as of January 2018):

  1. Telephone sets and terminal equipment 337.2 billion yen (+1.6% over the same quarter of the previous year)

    Of which, mobile phones was 334.5 billion yen (+1.7% over the same quarter of the previous year), cordless handsets for landline phones was 1.2 billion yen (-24.5% over the same quarter of the previous year) and other was 1.5 billion yen (+4.9% over the same quarter of the previous year). Imports of mobile phones started to pick up partly due to last-minute demand ahead of the consumption tax hike despite a general reluctance to buy in anticipation of changes to phone plans.

  2. Network equipment 169.1 billion yen (+10.7% over the same quarter of the previous year)

    Of which, base stations was 8.8 billion yen (+14.8% over the same quarter of the previous year), data communication equipment was 155.6 billion yen (+11.5% over the same quarter of the previous year) and other network equipment was 4.7 billion yen (-13.9% over the same quarter of the previous year). Imports of « other data telecom equipment (transmission equipment, communications equipment, modem, etc.) » in the data telecom equipment category showed positive growth of 29.9% over the same quarter of the previous year due to growing domestic demand for wireline network equipment such as backbone systems.

  3. Parts (both wireline and wireless)

    47.6 billion yen (-17.9% over the same quarter of the previous year).

(2) Detailed trends by region

A breakdown of results for April through June by region shows that Asia was 511.3 billion yen (+1.2% over the same quarter of the previous year), of which China was 374.4 billion yen (+1.0% over the same quarter of the previous year). North America was 18.3 billion yen (+14.6% over the same quarter of the previous year), of which the U.S. accounted for 17.2 billion yen (+14.2% over the same quarter of the previous year). Europe was 10.7 billion yen (-25.0% over the same quarter of the previous year), of which the EU was 10.4 billion yen (-26.3% over the same quarter of the previous year). Imports of « other data telecom equipment (transmission equipment, communications equipment, modem, etc.) » in the data telecom equipment category increased from all regions (Asia, Europe and North America).

(3) Comparison and breakdown by regions

First:Asia92.3%      (-0.8% over the same quarter of the previous year)
Second:North America1.9%        (-1.2% over the same quarter of the previous year)
Third:Europe3.3%        (+1.3% over the same quarter of the previous year)
Other regions:2.5%        (+0.7% over the same quarter of the previous year)

VI. Trends in Orders Received and Shipped

(from CIAJ statistics)

(1) FY20191st quarter actual

CIAJ statistics for total orders received and shipped in April through June amounted to 367.4 billion yen, representing positive growth of 3.2% over the same quarter of the previous year. Of which the total value of domestic shipments totaled 293.2 billion yen, representing positive growth of 8.2% over the same quarter of the previous year) and exports was 74.2 billion yen, representing negative growth of 12.7% over the same quarter of the previous year).

*CIAJ statistics for total orders received and shipped = orders received and shipped by CIAJ member companies
(=value of shipments for the domestic market (domestic production + foreign production) + value of exports = value of domestic production + value of imports of products produced abroad)

(2) Trend by categories

  1. Wireline terminal equipment 126.5 billion yen (-4.6% over the same quarter of the previous year).

    Cordless telephone sets and other telephone sets held firm but exports of personal and office-use facsimiles (including multi-functioning devices), which are easily influenced by overseas economies, continued to fall.

  2. Mobile terminal equipment 122.1 billion yen (-4.7% over the same quarter of the previous year).

    Demand for mobile phones was weak amid a general reluctance to buy in anticipation of changes to tariff plans. Exports of other mobile equipment (commercial/MCA radio terminals, etc.) were brisk.

  3. Wireline network equipment 46.3 billion yen (+15.5% over the same quarter of the previous year).

    Exports of wireline network equipment such as digital transmission devices were lackluster but domestic demand expanded substantially, resulting in growth over the same quarter of the previous year.

  4. Wireless network equipment 54.9 billion yen (+52.0% over the same quarter of the previous year).

    Government demand for emergency and MCA radio networks, private sector demand for microwave communication equipment and government demand for satellite communication equipment increased, leading to positive growth over the same quarter of the previous year.

  5. Other network equipment 9.9 billion yen (+10.4% over the same quarter of the previous year).

    Demand for LAN switches for data centers, etc. remained strong, resulting in positive growth over the same quarter of the previous year.

  6. Communication equipment parts

    7.1 billion yen (-26.5% over the same quarter of the previous year)

CIAJ Releases Report on the Study of Mobile Device Use – Longer renewal cycles and a possible turning point for low-cost carriers Excitement over 5G potential –

CIAJ conducted its annual study of mobile device use and announces the release of FY2019 findings as follows.

  • The use of smartphone has spread to all age groups, including those in their 60’s. This has also translated into a slower growth rate as the market matures.
  • Intention to renew current device dropped by 25 points to approximately 41%. The renewal cycle was 4 months longer than last year’s figure, reaching almost 3 years.
  • The number of subscribers to low cost carriers, made up of “sub-brands (Y!Mobile, UQ mobile)” operated by the major carriers (MNOs) and MVNOs, indicated a decrease over the last fiscal year.
  • SNS has been embraced as a feature that is used frequently throughout peoples’ everyday lives. On the other hand, use of games and music features, and viewing videos has decreased.
  • Interest and awareness of 5G is over 70%, with 30% of respondents understanding what it is.
  • 5G services that respondents want to use: high-resolution images, high-speed downloads, AR, VR, autonomous driving, etc.

(1) Summary

This study has been conducted as a fixed-point observation every April since 1998 to capture on-going changes in the domestic mobile communications market and include data from the busiest sales season of the year in March.

CIAJ mailed questionnaires to 1,200 mobile phones users (100 male & 100 female users in each of the following age groups: under twenty, twenties, thirties, forties, fifties, sixties) residing in the larger Tokyo and Osaka metropolitan areas from the end of March through early April of this year.

Unique findings from this year’s study are as follows.

(2) Results

(1) Device Trends

<Type of device owned>

  • The 1,200 people surveyed owned a total of 1,552 devices, categorized into smartphones, featurephones, tablets (with telecom subscription), tablets (WiFi only), mobile WiFi routers, and others (including PHS).
  • 1,156 respondents (96.3%) said their main-use device was a smartphone, while 39 respondents (3.3%) said it was a feature phone.

<Slower growth of smartphone users>

  • Smartphone use has gained popularity in all age groups, including respondents in their 60s, with the growth rate slowing in comparison to the previous year to 0.6%.

<Continuing decline in featurephone users>

  • Featurephone users also decreased by 0.6% over the previous year to 3.3%.

<Decrease in respondents using multiple devices>

  • 32.9% of respondents stated they use multiple devices, which is a drop over the previous year’s figure of 44.0%.
  • Of those using multiple devices, 79.5% (295 devices) were tablets (with telecom subscription) and 8.1% (30 devices) were smartphones.

(2) User Trends Among Low Cost Carrier Services

<Low cost carrier users reverts to negative growth>

  • 12.8% of respondents were using low cost carrier services, which includes MVNOs as well as “sub-brands” operated by the major carriers (MNOs), which is 10.1 points lower than the previous year, indicating a halt in growth.
  • Although overall satisfaction rates over contracts with low cost carriers were high, dissatisfaction over rates were higher compared to the previous year in the following categories: “data transmission charges (2018: 1.9% to 2019: 7.7%)” and “voice communication charges (2018: 0.8% to 2019: 6.5%).”

(3) Intent to purchase replacement device

<Lower intention to replace devices>

  • 40.7% of respondents indicated intention to purchase a replacement, which was 25 pints lower than last year. The figure had fluctuated between 60 – 80% since 2011, but dropped far below 50% for the first time, highlighting the weak intention to replace current devices.

(4) Decisive Factors for New Purchases

<Less emphasis on features and functions>

  • There was a significant drop overall in features and functions (waterproof, size, operability, etc.) compared to the previous year. On the other hand, there was more interest in the carrier and related services.

(5) Use of Handset Features and Services

<SNS features becoming must-have tools, while use of entertainment features declined>

  • As the choice in services increases, SNS has been embraced as a feature used on a daily basis, while e-mail and entertainment-related features such as games, viewing videos and music are on the decrease.

(6) Interest and awareness of 5G

<Growing excitement over potential of 5G>

  • Awareness of 5G was 73%, indicating strong interest.
  • 5G services respondents were interested in using reflect new services which take advantage of 5G-unique features, such as high-resolution image transmissions, including 4K/8K (96.2%), downloading movie-length videos in seconds (74%), virtual games using AR/VR technologies (69.9%)

For details, contact

ICT Network & Mobile Technology Development
tel: 81-3-5403-9358 fax: 81-3-5403-9360

For more general inquiries, contact

Corporate Communications
tel: 81-3-5403-9351 fax: 81-3-5403-9360

Telecommunication Equipment Production and Trade Figures for FY2018 (April-March) –Production and trade were sluggish, reflecting the impact of global slowdown, but growth in equipment related to wireline networks picked up–

The Communication and Information network Association of Japan (CIAJ) announces the telecommunication equipment production and trade figures for FY2018 (April-March) as follows.

In FY2018, the Japanese economy slowed. Real GDP growth rate for FY2018 is 0.6%, but this marks a significant slowdown from growth of 1.9% for FY2017. With the strong business conditions experienced in FY2017 continuing into FY2018, domestic demand related to private consumption and business spending grew sharply initially. Then, growth turned negative partly because of the effects of reactionary decline, unseasonable weather and natural disasters. From the second half of the fiscal year, labor-saving investment in production equipment and demand related to the Olympic and Paralympic games was firm and, with private consumption picking up largely on expectation of growth in nominal wages, domestic demand growth also remained in positive territory. However, against the backdrop of slowdown in China and other emerging economies, exports fell sharply and, with the economy already in a state where domestic demand was not a growth driver, domestic demand slumped even further due to global economic uncertainty amid the confusion caused by trade tensions between the US and China and Brexit.

Looking specifically at the telecom market, demand for terminal equipment decreased due to lengthening of the replacement cycle but demand for communication network facilities is starting to pick up on expectation of a sharp increase in data traffic due mainly to fifth-generation mobile communication systems (5G). The total value of exports decreased sharply, reflecting a major slump in parts used in the production of smartphones caused by slowdown in the world economy. The total value of imports also fell, reflecting a slump in parts due to weak domestic production and subdued production of mobile phones by Japanese manufacturers overseas and overseas manufacturers.

I. Domestic Market Trends

(1) FY2018 actual

The size of the domestic market (including the value of imports of foreign brands) was calculated from government figures, the Indices of Industrial Production and Trade Statistics of Japan, according to the following formula:

Domestic market size = value of domestic production – value of exports + value of imports

The total value of the domestic market in FY2018 (April – March) was 2,869.7 billion yen, representing negative growth of 3.3% over FY2017. This was the first negative growth for two years.

(2) Trend by categories

Actual figures by category in FY2018 (April – March) were as follows:

  1. Terminal equipment
    2,065.6 billion yen (-5.3% over FY2017)

  2. Network equipment
    804.1 billion yen (+2.2% over FY2017)

II. Domestic Production

(1) FY2018 actual

The total value of production in FY2018 (April – March) was 430.2 billion yen, representing negative growth of 16.9% over FY2017. The value of domestic production was below the year-ago level due to a slowdown in production of mobile-related terminals and base stations during a technological innovation phase and decline in production for export because of the slowdown of the world economy, offsetting an upturn in production wireline terminal equipment and wireline network equipment.

(2) Trend by categories

Actual figures by category in FY2018 (April – March) were as follows:

  1. Wireline terminal equipment

    53.6 billion yen (+0.7% over FY2017). Of which, telephone sets was 3.5 billion yen (+11.4% over FY2017) and key telephones 16.4 billion yen (-6.3% over FY2017), intercoms 32.3 billion yen (+3.6% over FY2017) and facsimiles 1.3 billion yen (unchanged). Categories that meet personal and household security needs are in an upward trend. Production of key telephones fell due to decreased exports, despite remaining flat in Japan due to a longer replacement demand cycle, which offset increased usage as an alternative to PBXs.

  2. Mobile terminal equipment

    117.9 billion yen (-33.1% over FY2017). Of which, mobile phones (including public-use PHS) was 68.2 billion yen (-37.7% over FY2017). Production of mobile phones decreased sharply. This is because the device cost has increased due to the enhancement of features and performance, leading to lengthening of the replacement cycle and also because consumers are opting to wait for the introduction of plans that completely separate the device cost from monthly charges.

  3. Wireline network equipment

    123.8 billion yen (+1.1% over FY2017). Of which, central office switching systems was 8.8 billion yen (-16.3% over FY2017), PBXs was 7.3 billion yen (+4.4% over FY2017), digital transmission equipment was 43.2 billion yen (+11.1% over FY2017) and other transmission equipment was 58.2 billion yen (-2.7% over FY2017). Production of PBXs for domestic use is trending down due to use of mobile phones for extensions use, reduction in the number of devices and the number of lines due to office downsizing, and changes in classification of PBXs and keyphones. However, exports were strong. Regarding digital transmission equipment, investment in communication network facilities such as backbone systems is increasing in anticipation of an increase in data traffic.

  4. Wireless network equipment

    73.0 billion yen (-28.3% over FY2017). Of which, fixed telecommunication devices was 33.2 billion yen (-23.0% over FY2017) and base station equipment was 39.8 billion yen (-32.3% over FY2017). Total production of wireless network equipment was below the level a year earlier mainly due to decline in base stations for mobile networks, which outweighed growth in government demand for emergency/ MCA radio base stations and private sector demand for microwave communication equipment.

  5. Network access equipment

    32.5 billion yen (-5.7% over FY2017). Total production of network access equipment was below the year-ago level due to cuts following capital spending reviews prompted by the economic slowdown, despite growth in demand due to the replacement of existing devices for cloud computing and IoT and IT investment to strengthen security.

  6. Wireline parts (includes relay equipment for wireline systems)

    29.5 billion yen (+1.0% over FY2017). Production remained mostly flat because the slowdown of the Chinese economy led to decline in overseas demand for parts used in the production of smartphones.

III. Exports

(1) FY2018 actual

The total figure for exports in FY2018 (April – March) was 397.4 billion yen, representing significant negative growth of 28.4% over FY2017. The slowdown of the world economy led to decreased production of smartphones in China and other parts of Asia and the decreased exports of parts used in this production was a major contributing factor.

Exports of data communication equipment also showed negative year-over-year growth for the third consecutive year, reflecting decline in exports due to the slowdown of overseas economies. In telephone sets and handsets, exports of mobile phones to the U.S. continued to rise. Though small in terms of value, exports of base stations to the U.S. and EU increased and exports to Asia fell sharply.

(2) Trend by categories

Actual figures in FY2018 (April – March) by category are as follows (the facsimile category is no longer indicated from January 2018):

  1. Telephone sets and terminal equipment 29.8 billion yen (+67.0% over FY2017)
    Of which, mobile phones was 27.1 billion yen (+80.1% over FY2017), cordless handsets for landline phones was 300 million yen (-20.7% over FY2017), and other was 2.4 billion yen (-0.9% over FY2017).
  2. Network equipment 130.7 billion yen (-13.1% over FY2017)
    Of which, base stations was 4.5 billion yen (-37.3% over FY2017), data communication equipment was 122.7 billion yen (-11.1% over FY2017) and other network equipment was 3.5 billion yen (-33.8% over FY2017).
  3. Parts (both wireline and wireless) 237.0 billion yen (-38.7% over FY2017)

(3) Actual figures by region

A breakdown of results for FY2018 (April – March) by region shows that Asia was 261.2 billion yen (-38.5% over FY2017), of which China was 122.3 billion yen (-44.3% over FY2017). North America was 83.3 billion yen (+15.6% over FY2017), of which the U.S. was 82.2 billion yen (+15.8% over FY2017). Europe was 38.5 billion yen (-8.0% over FY2017), of which the EU was 33.6 billion yen (-8.0% over FY2017).

Exports to China decreased sharply, showing negative growth of 44.7% over FY2017 because the percentage of total parts exports accounted for by exports to China fell further to 44.3%. The value of exports of mobile phones to the U.S., which has recorded positive growth since 2017 QII, was 24.8 billion yen (+104% over FY2017).

(4) Comparison and breakdown by regions

First:Asia65.7%      (-10.8% over FY2017)
Second:North America21.0%      (+8.0% over FY2017)
Third:Europe9.7%      (+2.2% over FY2017)
Other regions:3.6%        (+0.6% over FY2017)

IV. Imports

(1) FY2018 actual

The total figure for exports in FY2018 (April – March) was 2,851.8 billion yen, representing negative growth of 3.5% over FY2017 due to decline in demand caused by weak domestic demand. In the mobile phone category, imports of smartphones fell because FY2018 was a trough year for two-year contracts and replacement demand was weak in anticipation of changes to phone plans. In the data communication equipment category, imports of other data communication equipment (transmission devices, communication devices, modems, etc.) grew 40.5% year on year in the fourth quarter and imports of communication network equipment such as backbone systems increased.

(2) Trends by categories

Actual figures by category for FY2018 (April-March) are as follows (the facsimile category is no longer indicated as of January 2018):

  1. Telephone sets and terminal equipment 1,923.9 billion yen (-2.2% over FY2017)
    Of which, mobile phones was 1,912.0 billion yen (-2.2% over FY2017), cordless handsets for landline phones was 5.1 billion yen (-13.3% over FY2017) and other was 6.7 billion yen (+3.1% over FY2017).
  2. Network equipment 705.5 billion yen (+4.0% over FY2017)
    Of which, base stations was 41.1 billion yen (-2.3% over FY2017), data communication equipment was 639.5 billion yen (+3.9% over FY2017) and other network equipment was 24.9 billion yen (+19.3% over FY2017).
  3. Parts (both wireline and wireless) 222.4 billion yen (-28.6% over FY2017).

(3) Actual figures by region

A breakdown of results for FY2018 (April – March) by region shows that Asia 2,686.7 billion yen (-4.4% over FY2017), of which China was 2,193.5 billion yen (-3.3% over FY2017). North America was 68.8 billion yen (-9.4% over FY2017), of which the U.S. accounted for 64.1 billion yen (-12.9% over FY2017). Europe was 54.0 billion yen (+50.3% over FY2017), of which the EU was 53.0 billion yen (+52.7% over FY2017).

In imports from Europe, base stations (+42% over FY2017), data communication equipment (+17% over FY2017) and communication network facilities increased.

(4) Comparison and breakdown by regions

First:Asia94.2%      (+0.8% over FY2017)
Second:North America2.4%        (-0.7% over FY2017)
Third:Europe1.9%        (-0.1% over FY2017)
Other regions:1.5%        (+0.1% over FY2017)

V. Trends in Orders Received and Shipped

(1) FY2018 actual

CIAJ statistics for total orders received and shipped amounted to 1,577.5 billion yen, which represents negative growth of 11.7% over FY2017. Of which, the total value of domestic shipments was 1,245.2 billion yen, representing negative growth of 9.7% over FY2017, and the total value of exports was 332.3 billion yen, representing negative growth of 18.4% over FY2017.

*CIAJ statistics for total orders received and shipped = orders received and shipped by CIAJ member companies
(=value of shipments for the domestic market (domestic production + foreign production) + value of exports = value of domestic production + value of imports of products produced abroad)

(2) Trend by categories

Actual figures by category for FY2018 (April-March) were as follows:

  1. Wireline terminal equipment
    551.8 billion yen (-8.6% over FY2017).
    Cordless telephone sets and other telephone sets showed growth, reflecting firm domestic demand. Meanwhile exports of personal and office-use facsimiles (including multi-functioning devices), which are easily influenced by overseas economies, fell sharply.
  2. Mobile terminal equipment
    543.8 billion yen (-13.1% over FY2017).
    Demand for mobile phones declined but demand for other mobile equipment (commercial/MCA radio terminals, etc.) doubled.
  3. Wireline network equipment
    197.5 billion yen (+1.6% over FY2017).
    Exports of wireline network equipment such as digital transmission devices, modems and media converters were lackluster but domestic demand was in an upward trend, resulting in growth over FY2017.
  4. Wireless network equipment
    208.9 billion yen (-26.5% over FY2017).
    In base station communication devices, government demand for emergency and MCA radio networks increased but demand for mobile phone base stations decreased because mobile communication systems are in an innovation phase. This led to negative growth over FY2017 in the category as a whole.
  5. Other network equipment
    41.2 billion yen (+9.5% over FY2017).
    Demand for LAN switches for data centers, etc. remained strong and demand for other devices and wireless LAN equipment also increased, resulting in positive growth over FY2017.
  6. Communication equipment parts
    34.2 billion yen (-16.1% over FY2017).

For details, contact

Market Research
CIAJ
tel: 81-3-5403-9356 fax: 81-3-5403-9360

For more general inquiries, contact

Corporate Communications
CIAJ
tel: 81-3-5403-9351 fax: 81-3-5403-9360

Telecommunication Equipment Production and Trade Figures For FY2018 as of QIII (October – December) 2018 – Smartphone demand stimulates robust trade –

The Communication and Information network Association of Japan (CIAJ) announces the telecommunication equipment and trade figures for October through December, 2018 as follows.

According to the Monthly Economic Report announced by the Cabinet Office on February 21, consumer spending and capital investments in the private sector is indicating a gradual recovery after the drop stemming from the natural disasters over the past year. However, the slowdown of the Chinese economy has led to a negative forecast in manufacturing and coporate profits, with overseas demand, especially in semi-conductors and parts for smart phones and assemblyline equipment, losing momentum.

Looking specifically at the telecom market, domestic capital investments in potential growth areas, such as network equipment for 5G and IoT service, is about to begin, but exports are declining with the slowdown of the Chinese economy and the resulting drop in demand for smartphone parts. The domestic market value saw a drop in demand for handsets, but exceded the figure for FY2016 QIII.

I. Domestic Market Trends (new category)

(Aggregated by CIAJ based on Indices of Industrial Production and Trade Statistics of Japan)

(1) FY2018 QIII actual

The size of the domestic market (including the value of imports of foreign brands) was calculated from government figures, the Indices of Industrial Production and Trade Statistics of Japan, according to the following formula:

Domestic market size = value of domestic production – value of exports + value of imports

The total value of the domestic market for October through December was 964.6 billion yen, or negative 8.9% growth over the same quarter in FY2017.

(2) Trend by categories

Actual figures by category for October through December were as follows:

  1. Terminal equipment
    746.0 billion yen (-13.8% over the same quarter of the previous year).

  2. Network equipment
    218.6 billion yen (+13.2% over the same quarter of the previous year).

Domestic Market (by categories/quarter)

II. Domestic Production

(Based on Indices of Industrial Production compiled by the Ministry of Economics, Trade and Industry)

(1) FY2018 QIII actual

The total value of production was 108.0 billion yen, or negative 9.0% growth over the same quarter in FY2017. Production of telephone sets targeting consumers, as well as key telephones and PBXs for enterprise use, wireline digital transmission equipment and network access equipment all showed positive growth, contibuting to minimize the drop in domestic production.

(2) Trend by categories

Actual figures by category for October through December were as follows:

  1. Wireline terminal equipment

    13.6 billion yen (+7.7% over the same quarter of the previous year). Of which telephone sets was 800 million yen (+23.9% over the same quarter of the previous year) and key telephones 3.9 billion yen (+9.2% over the same quarter of the previous year), intercoms 8.5 billion yen (+4.9% over the same quarter of the previous year) and facsimiles 400 million yen (+30.0% over the same quarter of the previous year). All categories indicated positive year-over-year growth.

  2. Mobile terminal equipment

    29.2 billion yen (-22.0% over the same quarter of the previous year). Of which mobile phones was 16.0 billion yen (-31.2% over the same quarter of the previous year) and public-use PHS 200 million yen (-28.6% over the same quarter of the previous year). Demand for mobile phones declined, as consumers opt to wait for the anticipated separation of device cost from monthly charges.

  3. Wireline network equipment

    29.8 billion yen (+0.3% over the same quarter of the previous year). Of which central office switching systems was 1.7 billion yen (-28.5% over the same quarter of the previous year), PBXs was 2.0 billion yen (+8.0% over the same quarter of the previous year) and digital transmission equipment was 9.8 billion yen (+7.1% over the same quarter of the previous year) and other transmission equipment was 14.5 billion yen (-1.9% over the same quarter of the previous year). Overseas and domestic demand for central office switching systems grew. Enhancement of communication network facilities to handle spiking data traffic led to demand growth for digital transmission equipment.

  4. Wireless network equipment

    18.3 billion yen (-20.2% over the same quarter of the previous year). Of which fixed telecommunication devices was 8.6 billion yen (-0.8% over the same quarter of the previous year) and base station equipment was 9.6 billion yen (-32.1% over the same quarter of the previous year). Private sector demand for microwave communication equipment and government demand for emergency/ MCA radio base station grew, but was not enough to cover the decline in base stations for mobile networks.

  5. Network access equipment

    9.7 billion yen (+12.8% over the same quarter of the previous year). Demand for data center LAN switches pushed the entire figure up for the category.

  6. Wireline parts (includes relay equipment for wireline systems)

    7.5 billion yen (+0.1% over the same quarter of the previous year). The slowdown of the Chinese economy resulted in the decline in production of smartphone parts.

III. Exports

(Compiled by CIAJ, based on based on Ministry of Finance’s “Trade Statistics”)

(1) FY2018 QIII actual

The total figure for exports for October through December was 106.6 billion yen, or -46.9% over the same quarter of the previous year. The slowdown of the Chinese economy resulted in the decline in production of smartphone parts and thus, the drop in the export of parts.

The figure for data communication equipment also took a hit from the slowdown of the Chinese economy. In telephone and handsets, the export of mobile phones to the U.S. has continued recording positive YoY growth since 2017 QII.

(2) Trend by categories

Actual figures from October through December by category are as follows (the facsimile category is no longer indicated from January 2018):

  1. Telephone sets and terminal equipment 9.3 billion yen (+44.0% over the same quarter of the previous year)
    Of which, mobile phones was 8.7 billion yen (+52.1% over the same quarter of the previous year), cordless handsets for landline phones was 60 million yen (-38.5% over the same quarter of the previous year), and other was 500 million yen (-16.3% over the same quarter of the previous year).
  2. Network equipment 33.8 billion yen (-9.2% over the same quarter of the previous year)
    Of which, base stations was 1.2 billion yen (-42.3% over the same quarter of the previous year), data communication equipment was 31.7 billion yen (-6.6% over the same quarter of the previous year) and other network equipment was 900 million yen (-23.8% over the same quarter of the previous year).
  3. Parts (both wireline and wireless) 63.5 billion yen (-59.6% over the same quarter of the previous year)

(3) Actual figures by region

By region, Asia was 69.0 billion yen (-58.2% over the same quarter of the previous year), of which China was 34.3 billion yen (-60.0% over the same quarter of the previous year). North America was 23.9 billion yen (+20.4% over the same quarter of the previous year), of which the U.S. was 23.6 billion yen (+20.0% over the same quarter of the previous year). Europe was 9.8 billion yen (-16.3% over the same quarter of the previous year), of which the EU was 8.5 billion yen (-16.2% over the same quarter of the previous year).

ThThe export to China significantly dropped for the second quarter in a row to -60.0% over the previous year. The export of mobile phones to the U.S. was 8.0 billion yen (+62.7% over the same quarter of the previous year) and has recorded positive growth since 2017 QII.

(4) Comparison and breakdown by regions

First:Asia64.7%      (-4.7% over the same quarter of the previous year)
Second:North America22.5%      (+4.2% over the same quarter of the previous year)
Third:Europe9.2%      (+0.4% over the same quarter of the previous year)
Other regions:3.6%        (+0.1% over the same quarter of the previous year)

IV. Imports

(Compiled by CIAJ, based on based on Ministry of Finance’s “Trade Statistics”)

(1) FY2018 QIII actual

The total figure for exports from October through December was 968.0 billion yen (-9.8% over the same quarter of the previous year). Domestic demand for mobile phones (import of both Japanese brands manufactured abroad and foreign brands) was low, as consumers show signs of waiting for the anticipated separation of device cost from monthly charges. Demand for network equipment is showing signs of picking up, with investments in network facilities.

(2) Trend by categories

Actual figures by category for October through December are as follows (the facsimile category is no longer indicated as of January 2018):

  1. Telephone sets and terminal equipment 712.6 billion yen (-13.1% over the same quarter of the previous year)
    Of which, mobile phones was 709.5 billion yen (-13.2% over the same quarter of the previous year), cordless handsets for landline phones was 1.3 billion yen (-31.5% over the same quarter of the previous year) and other was 6.7 billion yen (+27.3% over the same quarter of the previous year).
  2. Network equipment 173.6 billion yen (+12.1% over the same quarter of the previous year)
    Of which, base stations was 14.3 billion yen (+60.5% over the same quarter of the previous year), data communication equipment was 173.6 billion yen (+12.1% over the same quarter of the previous year) and other network equipment was 6.7 billion yen (+27.3% over the same quarter of the previous year).
  3. Parts (both wireline and wireless) 60.8 billion yen (-27.7% over the same quarter of the previous year).

(3) Actual figures by region

By region, Asia was 923.4 billion yen (-10.9% over the same quarter of the previous year), of which China was 763.4 billion yen (-10.8% over the same quarter of the previous year). North America was 19.0 billion yen (-5.3% over the same quarter of the previous year), of which the U.S. accounted for 17.6 billion yen (-10.0% over the same quarter of the previous year). Europe was 13.3 billion yen (+42.2% over the same quarter of the previous year), of which the EU was 12.9 billion yen (+40.6% over the same quarter of the previous year).

The import of mobile telephones from China in QIII declined by 11.9% year over year, dropping dramatically by 50.6% in December alone.

(4) Comparison and breakdown by regions

First:Asia95.4%      (+1.8% over the same quarter of the previous year)
Second:North America2.0%        (-0.8% over the same quarter of the previous year)
Third:Europe1.4%        (-0.9% over the same quarter of the previous year)
Other regions:1.2%        (-0.1% over the same quarter of the previous year)

V. Trends in Orders Received and Shipped

(from CIAJ statistics)

(1) FY2018 QIII actual

CIAJ statistics for total orders received and shipped amounted to 386.9 billion yen (-16.8% over the same quarter of the previous year) for the quarter. Of which the total value of domestic shipments totaled 300.2 billion yen (-15.7% over the same quarter of the previous year) and exports was 86.7 billion yen (-20.6% over the same quarter of the previous year).

CIAJ statistics for total orders received and shipped = orders received and shipped by CIAJ member companies
(total orders received and shipped = value of shipments for the domestic market (domestic production + foreign production) = value of domestic production + value of imports of products produced abroad)

(2) Trend by categories

Actual figures by category for October through December were as follows:

  1. Wireline terminal equipment
    134.2 billion yen (-10.5% over the same quarter of the previous year).
    Domestic demand for telephone sets and other indicated positive growth, but the economic slowdown abroad resulted in negative exports of personal and office-use facsimiles (including multi-functioning devices.
  2. Mobile terminal equipment
    142.5 billion yen (-21.0% over the same quarter of the previous year).
    Lower domestic demand for newer models resulted in negative growth. Among other mobile equipment, MCA/simple radio terminals showed healthy growth.
  3. Wireline network equipment
    46.0 billion yen (+3.4% over the same quarter of the previous year).
    The positive figure was led by growth in key telephones and digital transmission equipment.
  4. Wireless network equipment
    45.9 billion yen (-38.0% over the same quarter of the previous year).
    Demand for microwave communication equipment and base stations for emergency and MCA radio networks was positive, but demand for the category as a whole experienced a significant drop, as base stations for mobile communication networks remained low.
  5. Other network equipment
    9.6 billion yen (+0.5% over the same quarter of the previous year).
    Positive growth resulted from healthy demand for data center equipment, such as LAN switches.
  6. Communication equipment parts
    8.6 billion yen (-17.9% over the same quarter of the previous year).

For details, contact

Market Research
CIAJ
tel: 81-3-5403-9356 fax: 81-3-5403-9360

For more general inquiries, contact

Corporate Communications
CIAJ
tel: 81-3-5403-9351 fax: 81-3-5403-9360

“FY2018 – FY2023 Mid-Term Demand Forecast for Telecommunication Equipment” Gradual demand growth through 2023, with realization of Society 5.0

The Communications and Information network Association of Japan (CIAJ), a general incorporated association, released its “Mid-Term Demand Forecast for Telecommunication Equipment,” covering FY2018 through FY2023. The forecast looks at technology trends and new demand creation for terminal devices and infrastructure equipment with fifth generation mobile communications technology (5G), artificial intelligence (AI) and the internet of things (IoT), all expected to play a vital role in bringing the Japanese government’s Society 5.0 to life.

The FY2018 telecommunication market is forecast to end in negative growth with longer replacement cycles of mobile devices, shrinking demand for home and office-use telephone sets with less use and lower investment in telecom infrastructure as 4G nears end-of-life before cutover to 5G, but momentum for 5G investment has yet to pick up.

From FY2019 onwards, the realization of Society 5.0, integrating new services and technologies such as IoT services, 5G smartphones, autonomous driving, robots and AI will bring about a more convenient and enriching lifestyle that encourages greater consumption and provides solutions to social issues, such as lower birthrate and shrinking labor force. Demand for telecom terminal devices and core network equipment that is part of society’s fundamental infrastructure is expected to gradually grow the domestic telecommunication market towards FY2023.

I. Outline

The Japanese economy in FY2017 continued a gradual recovery, with growth in consumer spending, including automobiles and mobile telephones. Business investments in telecom equipment decreased, but spending in manufacturing equipment picked up. Recovery of global economies contributed to the healthy export of electronic parts for automobiles and mobile phones, which all led to the third straight positive real GDP growth at 1.6% for FY2017. The telecommunication equipment market in FY2017 benefited from the timing of the 2-year mobile contract cycle that encourages replacement of phones. Combined with the demand growth in internet-related equipment from new data center investments, the recovery of global economies and related business-use demand pushing the value of exports higher all played a part in the approximately 3.638 trillion yen demand for telecom equipment (2.9% year-over-year growth).

The gradual recovery being experienced by the Japanese economy in FY2018 is slowing and real GDP is expected to be 1.0% (the average of figures announced by 9 private sector research institutions as of November). Longer replacement cycles translating into less demand for handsets, the market entering a transition period to 5G mobile technology pushing capital investments lower led to the CIAJ forecast for telecommunication equipment demand in FY2018 of 3.519 trillion yen or a negative year-over-year growth of 3.3%. By category, LAN switches and fixed communication equipment are forecast to have positive growth for the year.

From FY2019 onwards, the realization of Society 5.0 is expected to push the market into a period of demand growth with the total market value in FY2023 forecast to reach 3.821 trillion yen, an increase of 5.0% over the FY2017 figure The equipment categories forecast to record positive growth over FY2017 are mobile terminals, base station equipment, LAN switches and fixed communication equipment.

II. Actual Figures (Chapter 2)

The total telecommunication equipment market figure for FY2017 was approximately 3.638 trillion yen (+2.9% year-over-year growth), with the domestic market accounting for about 3.200 trillion yen (+2.4% year-over-year growth), and exports accounting for 438.1 billion yen (+6.7% year-over-year growth).

(1) Consumer equipment total: 2.113 trillion yen (+11.6% year-over-year growth)

The actual FY2017 figure for the global market of mobile phones (including smartphones) grew in yen value at 38.539 trillion yen (+2.9% year-over-year growth), but decreased to 343.487 billion in U.S. dollars (-0.3% year-over-year growth).

Despite the longer replacement cycles, 2017 was the end of the 2-year contract renewal cycle, contributing to the 2.232 trillion yen domestic FY2017 mobile terminal market value (aggregate of smartphones, feature phones, mobile wi-fi routers and M2M modules) (+12.6% year-over-year growth). Exports amounted to 34.0 billion yen (-15% year-over-year growth).

The FY2017 domestic figure for cordless phones, personal facsimiles and multi-functioning personal facsimiles was 27.2 billion yen (-9.6% year-over-year growth), while exports was 28.3 billion yen +9.8% year-over-year growth).

(2) Enterprise equipment total: 539.7 billion yen (+2.3% year-over-year growth)

Demand for key telephones, PBXs and office-use cordless telephones were mostly replacement. Together with the shrinking demand for fixed telephone services and decreasing voice traffic, combined with longer replacement cycles contributed to the FY2017 domestic figure of 70.4 billion yen (-10.1% year-over-year growth) and 20.0 billion yen (-36.5% year-over-year growth) export figure for the overall category.

The cycle for purchasing office-use facsimiles tapered off, leading to the FY2017 domestic figure of 190.7 billion yen (-7.7% year-over-year growth). The continuing shift to multi-functioning facsimiles continued, resulting in 258.5 billion yen (+22.5% year-over-year growth) in exports.

(3) Infrastructure equipment total: 526.1 billion yen (-19.7% year-over-year growth)

The decrease in capital investment by telecom carriers played a part in the FY2017 figure for fixed terrestrial communication equipment of 43.3 billion yen (-5.0% year-over-year growth). The tough competition over global market share has led to price wars, but the demand for backhaul systems for LTE/4G mobile services helped increase exports to 25.2 billion yen (+19.4% year-over-year growth).

Fruition of predicted demand for quasi-zenith satellites lifted the domestic FY2017 figure for fixed satellite communication equipment to 107.1 billion yen (+4.9% year-over-year growth), but the export figure was 5.8 billion yen (-31.0% year-over-year growth).

The migration of PSTN (Public Switched Telephone Network) to IP and the lull in capital investments before the transition to the new 5G network resulted in the FY2017 domestic figure for central office switching systems, fixed communication equipment and base station equipment of 320.4 billion yen (-28.6% year-over-year growth), and exports was 24.4 billion (-16.0% year-over-year growth).

(4) Internet equipment total for domestic market: 285.0 billion yen (-2.0% year-over-year growth)

Demand continued to grow for LAN switches from telecom carriers, as they tackled traffic growth, especially among developed countries, with the global market amounting to 270.7 billion yen (+4.9% year-over-year growth), or 2.413 billion U.S. dollars (+1.7% year-over-year growth). Demand for enterprise-use LAN switches also continues to grow as need to accommodate high-speed, large volume transmission mounts and trends such as IoT expand use-case scenarios. The global market amounted to approximately 2.798 trillion yen (+11.9% year-over-year growth), or 24.933 billion U.S. dollars (+8.5% year-over-year growth).

The domestic LAN switch market (carriers + enterprise) was 166.4 billion yen (+4.5% year-over-year growth). Increasing capacity to keep up with the surge in data traffic by telecom carriers and building new or expanding existing data centers to keep up with cloud service offerings continued to fuel demand. Exports, on the other hand recorded negative growth as Japanese brands had difficulty gaining a competitive edge in the global market.

In routers and optical access equipment, capital investment in optical fiber networks and measures to tackle mobile data traffic tapered off in FY2017 amounting to 118.6 billion yen (-9.6% year-over-year growth) for the domestic market. The value of exports was 400 million yen (-20.0% year-over-year growth)

(5) Equipment/parts categories not included above: 174.3 billion yen (+2.8% year-over-year growth)

III. Forecast Figures (Chapter 3)

[1] FY2018 Forecast

The total telecommunication equipment market figure for FY2018 is forecast at approximately 3.519 trillion yen (-3.3% year-over-year growth), with the domestic market accounting for 3.971 trillion yen (-3.2% year-over-year growth), and exports accounting for 421.8 billion yen (-3.7% year-over-year growth).

(1) Consumer equipment total: 2.665 trillion yen (-2.2% year-over-year growth)

The replacement cycle of mobile terminals continues to become longer, impacted by such factors as the scrutiny from a Ministry of Internal Affairs and Communications (MIC) task force over extreme discounts on terminals. The value of shipments for the domestic market in FY2018 is forecast to amount to 1.984 trillion yen, (-1.9% year-over growth), while exports decrease to 28.9 billion yen (-14.9% year-over growth). Frequency of use and replacement cycles continue to become fewer and longer for cordless phones and personal facsimiles and is reflected in the FY2018 domestic market figure of 25.4 billion yen (-6.8% year-over growth) and exports at 28.0 billion yen (-0.9% year-over growth).

(2) Enterprise equipment total: 503.7 billion yen (-6.7% year-over-year growth)

Replacements are central to demand for key telephones, PBXs and office-use cordless phones. The forecast for the FY2018 domestic market is 67.7 billion yen (-3.9% year-over growth), with exports amounting to 19.3 billion yen (-3.7% year-over growth). The migration from simple office-use facsimiles to multi-functioning facsimiles continues, with multi-functioning facsimiles making up the bulk of exports. The FY2018 domestic market is expected to decline to 184.4 billion yen (-3.3% year-over growth), while exports are forecast at 232.4 billion yen (-10.1% year-over growth).

(3) Infrastructure equipment total: 481.3 billion yen (-8.5% year-over-year growth)

The most recent domestic demand cycle for central office switching systems, digital transmission equipment, fixed communication equipment and base stations is expected to have slowed, with domestic market value in FY2018 expected to be 412.4 billion yen (-12.4% year-over growth). On the other hand, robust global economies are forecast to have increased overseas demand for base stations and fixed communication equipment, leading to exports reaching 68.9 billion yen (+24.4% year-over growth).

(4) Internet equipment total: 289.7 billion yen (+1.6% year-over-year growth)

Active investments in data centers is forecast to continue to sustain domestic demand for routers, LAN switches and optical access equipment, amounting to 289.7 billion yen (+1.6% year-over-year growth) in FY2018 and exports to be almost negligible.

(5) Equipment/parts categories not included above: 177.7 billion yen (+1.9% year-over-year growth)

[2] Midterm Projection

The FY2023total figure is projected at 3.821 trillion yen (+5.0% growth over FY2017), with the domestic market accounting for 3.398 trillion yen (+6.2% growth over FY2017) and exports accounting for 423.2 billion yen (-3.4% growth over FY2017).

(1) Consumer equipment total 2.257 trillion yen (+6.9% over FY2017)

The global mobile phone market (includes smartphones) is expected to grow with the launch of 5G services around 2019, with sales revenue in FY2022 projected at 380.5 billion U.S. dollars (CAGR 2.1% over FY2017). Commercial 5G service availability is expected to become widespread around 2020, with 5G-compatible devices accounting for 23.6% of all handsets sold in 2022.

The domestic market will continue to see even longer replacement cycles for mobile phones, and the government pressure to lower mobile carrier charges and the ensuing move to separate handset cost from communication charges from the latter half of FY2018 will dampen demand. However, Rakuten’s entry into the MNO market, and the ensuing marketing efforts by existing MNOs should stimulate the market together with new 5G models appearing in 2020 onwards. Altogether, the total value of the domestic market in FY2023 for mobile communication devices is projected at 2.199 trillion yen (+8.7% growth over FY2017), with exports at 12.9 billion yen (-62.1% growth over FY2017)

Although some concentrated demand for cordless phones and personal facsimiles among older adult households can be expected, overall demand is forecast to shrink. The total value of the domestic market in FY2023 is projected at 18.3 billion yen (-32.7% growth over FY2017), with exports at 26.8 billion yen (-5.3% growth over FY2017).

(2) Enterprise equipment total: 476.4 billion yen (-11.7% over FY2017)

In key telephones, PBXs and office-use cordless phones, new demand for BCP (business contingency plan) initiatives to secure communications during natural disasters, nurse call systems for nursing care facilities, multi-lingual services for accommodations targeting foreign tourists and shifts to lower energy consumption models will not be enough to overcome negative factors, which will include migration to cloud services and IP, as well as replacement by smartphones. The total value of the domestic market in FY2023 is projected at 57.0 billion yen (-19.0% growth over FY2017), with exports at 18.8 billion yen (-6.3% growth over FY2017).

Despite the surge in construction of accommodations and public facilities towards 2020, domestic demand for office-use facsimiles will shrink even further, as means of communications shifts to e-mail and other medium, frequency of use diminishes and replacement cycles become longer. All in all, the total value of the domestic market for office-use facsimiles in FY2023 is projected at 155.9 billion yen (-18.3% growth over FY2017). Although Japanese brands have a large share of the global multi-function facsimile market, tough price wars to compete with the second-hand market are reflected in the forecast for exports at 244.7 billion yen (-5.3% growth over FY2017).

(3) Infrastructure equipment total: 621.5 billion yen (+18.1% over FY2017)

Accommodating rise in mobile traffic with the launch of 5G, enhancements in domestic network speed to handle large-volume data such as 4K/8K contents, demand growth of data centers and ensuing capacity for massive amounts of data and emergency information systems necessary for natural disasters are projected to lead to significant demand growth for infrastructure equipment. The domestic market value of central office switching systems, digital transmission equipment, fixed communication equipment and base stations in 2023 is expected to reach 545.9 billion yen (+16.0% growth over FY2017) and exports are projected at 75.6 billion yen (+36.6% growth over FY2017).

(4) Internet equipment total: 300.9 billion yen (+5.6% over FY2017)

Investment in system infrastructure among emerging markets is expected to have a positive impact on global demand for routers, but increasing virtualization among developed countries and dropping unit prices have led to the projection of 2.717 billion U.S. dollars (CAGR -1.4%) for telecom carrier routers in FY2022. On the other hand, the global market for LAN switches targeting enterprise use is forecast to grow, not only to keep up with higher speeds and exploding data volumes, but to also accommodate IoT devices and cloud services, reflected in the forecast of 28.430 billion U.S. dollars (CAGR +2.6%).

In the domestic market for internet equipment, telecom carriers are expected to make further investments in their facilities to handle increasing mobile traffic from smartphones and widespread utilization of IoT, but the pressure to lower equipment and per port unit prices from aggressive competition, as well as advances in virtualization with standard hardware will push figures down. Altogether, the FY2023 projection for the domestic market value of routers, LAN switches and optical access equipment is projected to amount to 300.9 billion yen (+5.6% growth over FY2017).

(5) Equipment/parts categories not included above: 165.1 billion yen (-5.3% year-over-year growth)

IV. Trends in the Info-Communication Industry Market (Chapters 4)

The Chapter explains recent market trends in ICT solutions and value-added services. Section 1 covers advances in virtualization and distributed processing technologies, while section 3 covers new topics, such as the growing AR/VR contents and the popularity of the sharing economy.

Domestic market forecasts are based on statistics compiled by CIAJ and interviews with CIAJ members, with the cooperation of InfoCom Research, Incorporated, for areas not covered by CIAJ.

Global ICT market forecasts and demand trends refer to and utilize data and analysis provided by a global research company HIS Markit with the cooperation of InfoCom Research, Incorporated.

Please contact Mr. Nakai (e-mail: s_nakai[at]ciaj.or.jp) to purchase a copy of the CIAJ Mid-Term Demand Forecast for Telecommunication Equipment (2018 – 2023) (6,000 yen + tax for CIAJ members, 19,000 yen + tax for non-CIAJ members). The CIAJ Mid-Term Demand Forecast for Telecommunication Equipment is available in Japanese only.

For details, contact

Market Research
CIAJ
tel: 81-3-5403-9356 fax: 81-3-5403-9360

For more general inquiries, contact

Corporate Communications
CIAJ
tel: 81-3-5403-9351 fax: 81-3-5403-9360

Telecommunication Equipment Production and Trade Figures For the First Half of FY2018 (April – September) – Production and exports for 5G infrastructure slows during transition –

The Communications and Information network Association of Japan (CIAJ: a general incorporated association) announces the telecommunication equipment production and trade figures for April through September, 2018 as follows.

The Cabinet Office of Japan announced a -1.2% real GDP (annual) growth for July – September (1st update), returning to negative growth after a pick up last quarter. Major contributing factors included the impact from natural disasters, which led to lower consumer spending and damage to factories producing equipment for export. Though many businesses reporting higher revenues and companies are investing to tackle labor shortages and aging facilities, which raises domestic demand, the current Japanese economy relies heavily on overseas demand and the slowing growth of economies abroad, especially China and the ongoing trade conflict, all contribute to slowing exports and increasing risk for the Japan.

The domestic telecommunication equipment market is experiencing negative demand growth with longer renewal cycles of mobile devices, lower investment in telecom infrastructure as 4G nears end-of-life before cutover to 5G, but momentum for 5G investment has yet to begin and lower demand for exports due to slowing economies abroad. Domestic production continues to decline year-over-year (YoY) with the ongoing shift of production overseas, but the domestic market size exceeded the figures for the first half (H1) of FY2016 and FY2017.

I. Domestic Market Trends (new category)

(Aggregated by CIAJ based on Indices of Industrial Production and Trade Statistics of Japan)

(1) FY2018 first half (H1) actual

The size of the domestic market (including the value of imports of foreign brands) was calculated from government figures, the Indices of Industrial Production and Trade Statistics of Japan, according to the following formula:

Domestic market size = value of domestic production – value of exports + value of imports

The total value of the domestic market for April through September was 1.207 trillion yen, or positive 3.9% growth over the same period in FY2017.

(2) Trend by categories

Actual figures by category for April through September were as follows:

  1. Terminal equipment
    844.0 billion yen (+10.5% over the same quarter of the previous year).

  2. Network equipment
    362.7 billion yen (-8.7% over the same quarter of the previous year).

Domestic Market (by category, H1/H2)

II. Domestic Production

(Based on Indices of Industrial Production compiled by the Ministry of Exonomics, Trade and Industry)

(1) FY2018 H1 actual

The total value of production was 200.6 billion yen, or negative 18.9% growth over the same period in FY2017. There was continuing shift of manufacturing facilities abroad and the slowdown of global economies translated into less production targeting exports. Domestic production figures for mobile phones and network equipment were especially lower as mobile systems experienced a lull before the transition to the new 5G network.

(2) Trend by categories

Actual figures by category for April through September were as follows:

  1. Wireline terminal equipment

    25.8 billion yen (±0% over the same period of the previous year). Of which telephone sets was 1.7 billion yen (-4.1% over the same period of the previous year) and key telephones 8.1 billion yen (-4.0% over the same period of the previous year), intercoms 15.3 billion yen (+2.0% over the same period of the previous year) and facsimiles 700 million yen (+18.3% over the same period of the previous year). Most categories recorded lower YoY figures.

  2. Mobile terminal equipment

    62.9 billion yen (-24.8% over the same period of the previous year). Of which mobile phones was 42.9 billion yen (-30.3% over the same period of the previous year) and public-use PHS 500 million yen (-35.0% over the same period of the previous year). Demand for mobile phones was low, as the period was in between the 2-year contract renewal cycle, as well as aggressive campaigns by foreign brands.

  3. Wireline network equipment

    52.8 billion yen (-10.2% over the same period of the previous year). Of which central office switching systems was 4.0 billion yen (-14.6% over the same period of the previous year), PBXs was 2.9 billion yen (±0% over the same period of the previous year) and digital transmission equipment was 16.9 billion yen (-12.0% over the same period of the previous year) and other transmission equipment was 26.3 billion yen (-7.2% over the same period of the previous year). Despite healthy export demand for PBXs, the value of domestic production is following a downward trend. The same trend applies to digital transmission equipment.

  4. Wireless network equipment

    30.7 billion yen (-34.5% over the same period of the previous year). Of which fixed telecommunication devices was 11.9 billion yen (-23.1% over the same period of the previous year) and base station equipment was 18.8 billion yen (-40.1% over the same period of the previous year). Domestic production declined with the exception of base stations for the public sector emergency and MCA radio systems.

  5. Network access equipment

    13.0 billion yen (-27.1% over the same period of the previous year). Demand for network equipment decreased despite growth in LAN switches for data centers.

  6. Wireline parts (includes relay equipment for wireline systems)

    15.4 billion yen (+6.6% over the same period of the previous year). Increased overseas production of new smart phone models by Japanese as well as U.S. brands resulted in a higher figure.

III. Exports

(Compiled by CIAJ, based on based on Ministry of Finance’s “Trade Statistics”)

(1) FY2018 H1 actual

The total figure for exports for April through September was 208.4 billion yen, meaning the figure returned to negative growth for the first time in three periods at -13.7%. The overall slowdown in global economies and the decrease in production of smartphones in China for the Chinese and Asian markets resulted in a drop in the export of related parts.

In data communication equipment, demand for wireline network equipment, such as central office switching systems and digital transmission equipment continued to grow, but was not enough to out-balance the decline in wireless network equipment, as the market entered a transition period to new mobile technology. All together, the category fell below 60 billion yen for the first time in 12 periods.

In telephone and handsets, export of mobile phones to the U.S. recorded positive YoY growth since 2017 Q2 and continues into Q2 of 2018. The yen value of base station exports is small, but there was positive growth to the U.S., the EU and Latin and South America, while the export value to Asia decreased.

(2) Trend by categories

Actual figures from April through September by category are as follows (the facsimile category is no longer applied from January 2018):

  1. Telephone sets and terminal equipment 12.2 billion yen (+86.9% over the same period of the previous year)
    Of which, mobile phones was 10.5 billion yen (+103.9% over the same period of the previous year), cordless handsets for landline phones was 180 million yen (-11.6% over the same period of the previous year), and other was 1.5 billion yen (+31.8% over the same period of the previous year).
  2. Network equipment 62.7 billion yen (-12.8% over the same period of the previous year)
    Of which, base stations was 2.7 billion yen (-9.2% over the same period of the previous year), data communication equipment was 58.2 billion yen (-11.8% over the same period of the previous year) and other network equipment was 1.8 billion yen (-38.4% over the same period of the previous year).
  3. Parts (both wireline and wireless) 133.5 billion yen (-18.1% over the same period of the previous year)

(3) Actual figures by region

By region, Asia was 144.7 billion yen (-20.1% over the same period of the previous year), of which China was 69.0 billion yen (-27.7% over the same period of the previous year). North America was 38.2 billion yen (+12.4% over the same period of the previous year), of which the U.S. was 37.6 billion yen (+12.5% over the same period of the previous year). Europe was 18.4 billion yen (-3.7% over the same period of the previous year), of which the EU was 16.0 billion yen (-6.5% over the same period of the previous year).

The export of parts to China decreased to 45.5% of total exports. The production of smartphones among Asian countries other than China increased, especially in Vietnam and Singapore. The export of mobile phones to the U.S. was 9.5 billion yen (+163% over the same period of the previous year) and has recorded positive growth since 2017 Q2.

(4) Comparison and breakdown by regions

First:Asia69.4%      (-5.5% over the same quarter of the previous year)
Second:North America18.3%      (+4.1% over the same quarter of the previous year)
Third:Europe8.8%      (+0.9% over the same quarter of the previous year)
Other regions:3.5%        (+0.5% over the same quarter of the previous year)

IV. Imports

(Compiled by CIAJ, based on based on Ministry of Finance’s “Trade Statistics”)

(1) FY2018 H1 actual

The total figure for exports from April through September was 1.211 trillion yen (+3.8% over the same period of the previous year). In mobile phones, there was a rise in imports of Japanese brand smartphones manufactured abroad as well as U.S. brands in Q2. Network equipment also decreased as the market entered a transition period to new mobile technology.

(2) Trend by categories

Actual figures by category are as follows (the facsimile category is no longer applied from January 2018):

  1. Telephone sets and terminal equipment 767.4 billion yen (+16.6% over the same period of the previous year)
    Of which, mobile phones was 761.6 billion yen (+16.8% over the same period of the previous year), cordless handsets for landline phones was 2.7 billion yen (+3.8% over the same period of the previous year) and other was 3.1 billion yen (-9.6% over the same period of the previous year).
  2. Network equipment 328.9 billion yen (-4.9% over the same period of the previous year)
    Of which, base stations was 19.7 billion yen (-18.8% over the same period of the previous year), data communication equipment was 297.1 billion yen (-4.8% over the same period of the previous year) and other network equipment was 12.0 billion yen (+27.4% over the same period of the previous year).
  3. Parts (both wireline and wireless) 114.5 billion yen (-29.6% over the same period of the previous year).

(3) Actual figures by region

By region, Asia was 1.133 trillion yen (+3.3% over the same period of the previous year), of which China was 903.2 billion yen (+5.4% over the same period of the previous year). North America was 34.3 billion yen (-10.1% over the same period of the previous year), of which the U.S. accounted for 31.7 billion yen (-15.4% over the same period of the previous year). Europe was 27.8 billion yen (+69.1% over the same period of the previous year), of which the EU was 27.5 billion yen (+73.9% over the same period of the previous year).

The import from Europe grew substantially for most categories, specifically mobile telephones (+162.0% over the same period of the previous year), base stations (+166% over the same period of the previous year), data communication equipment (+26% over the same period of the previous year) and parts (+291% over the same period of the previous year).

(4) Comparison and breakdown by regions

First:Asia93.6%      (-0.3% over the same quarter of the previous year)
Second:North America2.8%        (-0.5% over the same quarter of the previous year)
Third:Europe2.3%        (+0.9% over the same quarter of the previous year)
Other regions:1.3%        (-0.2% over the same quarter of the previous year)

V. Trends in Orders Received and Shipped

(from CIAJ statistics)

(1) FY2018 H1 actual

CIAJ statistics for total orders received and shipped amounted to 731.7 billion yen (-13.8% over the same period of the previous year) for the period. Of which the total value of domestic shipments totaled 555.0 billion yen (-15.1% over the same period of the previous year) and exports was 176.8 billion yen (-9.4% over the same period of the previous year).

CIAJ statistics for total orders received and shipped = orders received and shipped by CIAJ member companies
(total orders received and shipped = value of shipments for the domestic market (domestic production + foreign production) = value of domestic production + value of imports of products produced abroad)

(2) Trend by categories

Actual figures by category for April through September were as follows:

  1. Wireline terminal equipment
    276.9 billion yen (-5.4% over the same period of the previous year).
    The telephone category grew in total together with imports of Japanese brand cordless handsets manufactured abroad. Exports of personal and office-use facsimiles (including multi-functioning devices) decreased with the slowdown in global economies.
  2. Mobile terminal equipment
    249.3 billion yen (-15.6% over the same period of the previous year).
    The 2-year mobile contract coverage cycle led to a negative figure for this period, but signs of a recovery were seen from August. MCA/simple radio terminals did well among the other groups in this category.
  3. Wireline network equipment
    86.5 billion yen (-13.0% over the same period of the previous year).
    Key telephone sets, modems and other transmission equipment category had positive growth, but was not enough to make up for drops in other categories.
  4. Wireless network equipment
    80.7 billion yen (-32.9% over the same period of the previous year).
    Demand for base stations for public sector emergency systems/MCA radios was positive, but the figure for the category as a whole was negative. The figure for the entire category was significantly lower as the market entered a transition period to newer mobile technology.
  5. Other network equipment
    20.4 billion yen (+4.4% over the same period of the previous year).
    Demand for data center equipment resulted in continued healthy growth for LAN switches.
  6. Communication equipment parts
    18.0 billion yen (-17.0% over the same period of the previous year).

For details, contact

Market Research
CIAJ
tel: 81-3-5403-9356 fax: 81-3-5403-9360

For more general inquiries, contact

Corporate Communications
CIAJ
tel: 81-3-5403-9351 fax: 81-3-5403-9360

Telecommunication Equipment Production and Trade Figures For Q1 (April – June) 2018 – Overseas market recovery lifts exports of some categories –

The Communication and Information network Association of Japan (CIAJ) announces the telecommunication equipment and trade figures for April through June, 2018 as follows.

Japan’s GDP during April through June 2018 grew YoY (year-over-year) at an annual rate of 1.9% according to the preliminary figures announced this month by the Cabinet Office. It was a return to positive growth after a decline last quarter. Underlying factors include higher consumer spending and robust capital investments compared to the January – March quarter. A gradual recovery is expected to continue as business and global economies continue to show a steady growth to encourage capital spending and healthy exports despite risks from the trade friction between the United States and China.

In the telecom equipment market, replacement demand for handsets and capital investments in cellular infrastructure is slowing. On the other hand, exports of key telephones, PBXs and digital transmission equipment reflected the healthy economic recovery abroad. The shift to overseas production continues, pushing down YoY domestic production, but the domestic market size has grown to exceed 2016 Q1.

I. Domestic Market Trends (new category)

(Aggregated by CIAJ based on Indices of Industrial Production and Trade Statistics of Japan)

(1) FY2018 1st quarter actual

The size of the domestic market (including the value of imports of foreign brands) was calculated from government figures, the Indices of Industrial Production and Trade Statistics of Japan, according to the following formula:

Domestic market size = value of domestic production – value of exports + value of imports

The total value of the domestic market was 535.4 billion yen, or negative 9.2% growth over the same quarter in FY2017. However, the figure is 1.7% above the 2016 Q1 figure, indicating signs of an overall recovery.

(2) Trend by categories

Actual figures by category for April through June were as follows:

  1. Terminal equipment
    368.8 billion yen (-6.5% over the same quarter of the previous year).

  2. Network equipment
    166.6 billion yen (-14.8% over the same quarter of the previous year).

Table 1: Domestic Market (by categories/quarter)

(Note) Five-year Market Size Trends (Table 1-2)

The actual domestic market size from FY2013 through FY2017 was as follows. The figure in 2017 returned to positive growth for the first time in four years.

Table 2: Domestic Market (by categories/fiscal year)

II. Domestic Production

(Based on Indices of Industrial Production compiled by the Ministry of Exonomics, Trade and Industry)

(1) FY2018 1st quarter actual

The total value of production was 93.7 billion yen, or negative 22.6% growth over the same quarter in FY2017. With the recovery of economies abroad, production targeting exports did well, such as key telephones, PBXs, digital transmission equipment and parts for new smartphone models produced overseas. However, production for the domestic market, especially mobile phones and mobile infrastructure equipment continued to show negative growth, as the industry faces a technological transition period,  pushing the entire production figure lower.

(2) Trend by categories

Actual figures by category for April through June were as follows:

  1. Wireline terminal equipment

    11.4 billion yen (-5.8% over the same quarter of the previous year). Of which telephone sets was 700 million yen (-6.6% over the same quarter of the previous year) and key telephones 3.5 billion yen (-1.3% over the same quarter of the previous year), intercoms 6.9 billion yen (-8.5% over the same quarter of the previous year) and facsimiles 300 million yen (+12.1% over the same quarter of the previous year). The high demand for exports kept the figure for key telephones at basically same YoY levels.

  2. Mobile terminal equipment

    30.0 billion yen (-31.6% over the same quarter of the previous year). Of which mobile phones was 21.4 billion yen (-39.4% over the same quarter of the previous year) and public-use PHS 200 million yen (-41.9% over the same quarter of the previous year). Demand for mobile phones was low, as the period was in between the 2-year contract renewal cycle, as well as aggressive campaigns by foreign brands.

  3. Wireline network equipment

    25.4 billion yen (-10.7% over the same quarter of the previous year). Of which central office switching systems was 1.9 billion yen (-14.2% over the same quarter of the previous year), central office switching systems was 1.2 billion yen (+5.4% over the same quarter of the previous year) and digital transmission equipment was 8.2 billion yen (-16.2% over the same quarter of the previous year) and other transmission equipment was 12.9 billion yen (-8.6% over the same quarter of the previous year). Although export demand for central office switching systems grew and new demand from domestic office building and hotel construction is expected, the drop in unit price is expected to contribute to overall gradual decline.

  4. Wireless network equipment

    13.9 billion yen (-35.6% over the same quarter of the previous year). Of which fixed telecommunication devices was 5.2 billion yen (-6.5% over the same quarter of the previous year) and base station equipment was 8.7 billion yen (-45.8% over the same quarter of the previous year). Production of fixed communication devices for both terrestrial and satellite systems, as well as base station equipment for non-government use took a sharp decline.

  5. Network access equipment

    5.4 billion yen (-31.9% over the same quarter of the previous year). Demand for network equipment was strong with the growth in network traffic, but fierce competition with foreign brands resulted in negative domestic production.

  6. Wireline parts (includes relay equipment for wireline systems)

    7.6 billion yen (+6.6% over the same quarter of the previous year). Increased overseas production of new smart phone models by U.S. and other brands resulted in a higher figure.

III. Exports

(Compiled by CIAJ, based on based on Ministry of Finance’s “Trade Statistics”)

(1) FY2018 1st quarter actual

The total figure for exports for April through June was 96.2 billion yen. The figure remained basically unchanged at -1.5%, with the growth in production of parts targeting exports for new smartphone models produced in other Asian countries from Q1 balanced out by the decrease in data communication equipment.

In data communication equipment, demand for wireline network equipment, such as central office switching systems and digital transmission equipment grew, but was not enough to out-balance the decline in wireless network equipment, as the market entered a transition period to newer technology. All together, the export of digital communication equipment to almost all regions showed negative growth and fell below 30 billion yen for the first time in 22 quarters.

In telephone and handsets, exports of mobile phones to the U.S. has recorded positive YoY growth since 2017 Q2. The positive growth of exports of base stations to the U.S. and the EU was out-weighed by the significant drop to Asia.

(2) Trend by categories

Actual figures from April through June by category are as follows (the facsimile category is no longer applied from January 2018):

  1. Telephone sets and terminal equipment 4.6 billion yen (+202.9% over the same quarter of the previous year)
    Of which, mobile phones was 3.8 billion yen (+404.7% over the same quarter of the previous year), cordless handsets for landline phones was 130 million yen (+39.9% over the same quarter of the previous year), and other was 700 million yen (+5.1% over the same quarter of the previous year).
  2. Network equipment 30.6 billion yen (-15.3% over the same quarter of the previous year)
    Of which, base stations was 1.3 billion yen (-35.8% over the same quarter of the previous year), data communication equipment was 28.4 billion yen (-12.8% over the same quarter of the previous year) and other network equipment was 800 million yen (-43.3% over the same quarter of the previous year).
  3. Parts (both wireline and wireless) 61.0 billion yen (+1.6% over the same quarter of the previous year)

(3) Actual figures by region

By region, Asia was 65.9 billion yen (-4.4% over the same quarter of the previous year), of which China was 30.4 billion yen (-5.4% over the same quarter of the previous year). North America was 17.2 billion yen (+12.5% over the same quarter of the previous year), of which the U.S. was 16.9 billion yen (+12.8% over the same quarter of the previous year). Europe was 9.6 billion yen (-2.4% over the same quarter of the previous year), of which the EU was 8.5 billion yen (-3.6% over the same quarter of the previous year).

The export of parts to China decreased to 43.0% of total exports. The smartphone dissemination rate in China reached 100% in 2017 and production decreased with lower replacement demand. However, the shift in production to other Asian countries continues. The export of mobile phones to the U.S. was 3.4 billion yen (+5,529% over the same quarter of the previous year) and recorded the fourth consecutive positive growth since 2017 Q2.

(4) Comparison and breakdown by regions

First:Asia68.6%      (-7.9% over the same quarter of the previous year)
Second:North America17.9%      (+4.9% over the same quarter of the previous year)
Third:Europe10.0%      (+2.5% over the same quarter of the previous year)
Other regions:3.6%        (+0.6% over the same quarter of the previous year)

IV. Imports

(Compiled by CIAJ, based on based on Ministry of Finance’s “Trade Statistics”)

(1) FY2018 1st quarter actual

The total figure for exports from April through June was 542.4 billion yen (-8.1% over the same quarter of the previous year). Domestic demand for mobile phones was low, as the period was in between the 2-year contract renewal cycle and resulted in a negative YoY growth. Network equipment also decreased as the market entered a transition period to newer technology.

(2) Trend by categories

Actual figures by category are as follows (the facsimile category is no longer applied from January 2018):

  1. Telephone sets and terminal equipment 332.0 billion yen (-1.9% over the same quarter of the previous year)
    Of which, mobile phones was 329.0 billion yen (-1.9% over the same quarter of the previous year), cordless handsets for landline phones was 1.6 billion yen (+14.0% over the same quarter of the previous year) and other was 1.4 billion yen (-15.7% over the same quarter of the previous year).
  2. Network equipment 152.6 billion yen (-12.2% over the same quarter of the previous year)
    Of which, base stations was 7.7 billion yen (-12.8% over the same quarter of the previous year), data communication equipment was 139.5 billion yen (-12.7% over the same quarter of the previous year) and other network equipment was 5.4 billion yen (+5.8% over the same quarter of the previous year).
  3. Parts (both wireline and wireless) 57.9 billion yen (-26.1% over the same quarter of the previous year).

(3) Actual figures by region

By region, Asia was 505.2 billion yen (-9.0% over the same quarter of the previous year), of which China was 373.9 billion yen (-9.8% over the same quarter of the previous year). North America was 15.9 billion yen (-12.0% over the same quarter of the previous year), of which the U.S. accounted for 15.0 billion yen (-15.3% over the same quarter of the previous year). Europe was 14.3 billion yen (+67.9% over the same quarter of the previous year), of which the EU was 14.0 billion yen (+71.7% over the same quarter of the previous year).

The import of most categories from Europe grew substantially, specifically mobile telephones (+1,290.0% over the same quarter of the previous year), base stations (+336% over the same quarter of the previous year), data communication equipment (+23% over the same quarter of the previous year) and parts (+281% over the same quarter of the previous year).

(4) Comparison and breakdown by regions

First:Asia93.1%      (-0.3% over the same quarter of the previous year)
Second:North America3.1%        (-0.2% over the same quarter of the previous yearear)
Third:Europe2.0%        (+0.6% over the same quarter of the previous year)
Other regions:1.4%        (-0.1% over the same quarter of the previous year)

V. Trends in Orders Received and Shipped

(from CIAJ statistics)

(1) FY2018 1st quarter actual

CIAJ statistics for total orders received and shipped amounted to 356.0 billion yen (-14.2% over the same quarter of the previous year) for the quarter. Of which the total value of domestic shipments totaled 270.9 billion yen (-16.5% over the same quarter of the previous year) and exports was 85.0 billion yen (-5.7% over the same quarter of the previous year).

CIAJ statistics for total orders received and shipped = orders received and shipped by CIAJ member companies
(total orders received and shipped = value of shipments for the domestic market (domestic production + foreign production) = value of domestic production + value of imports of products produced abroad)

(2) Trend by categories

Actual figures by categories for April through June were as follows:

  1. Wireline terminal equipment
    132.5 billion yen (-2.6% over the same quarter of the previous year).
    Cordless handsets, other telephone terminals, office-use cordless handsets and intercoms did well, but the drop in domestic demand as well as exports of personal and office-use facsimiles (including multi-functioning devices) pushed the overall figure down.
  2. Mobile terminal equipment
    128.6 billion yen (-20.4% over the same quarter of the previous year).
    Low domestic demand due to brands refraining from launching new summer models as it was the period in the middle of the 2-year mobile contract coverage resulted in negative growth for the category.
  3. Wireline network equipment
    40.1 billion yen (-17.7% over the same quarter of the previous year).
    Other transmission equipment category had healthy growth, but was not enough to make up for drops in other categories.
  4. Wireless network equipment
    36.2 billion yen (-26.6% over the same quarter of the previous year).
    Demand for base stations from the public sector was positive, but domestic as well as export demand for the category as a whole was low, as the market entered a transition period to newer technology.
  5. Other network equipment
    9.0 billion yen (+12.2% over the same quarter of the previous year).
    Positive growth resulted from healthy demand for LAN switches and other categories.
  6. Communication equipment parts
    9.6 billion yen (-15.5% over the same quarter of the previous year).

For details, contact

Market Research
CIAJ
tel: 81-3-5403-9356 fax: 81-3-5403-9360

For more general inquiries, contact

Corporate Communications
CIAJ
tel: 81-3-5403-9351 fax: 81-3-5403-9360

CIAJ Releases Report on the Study of Mobile Device Use – Smartphone users make up over 90% of all age groups & Robust growth among low cost carriers –

CIAJ conducted its annual study of mobile device use and announces the release of this year’s findings as follows.

The ratio of people who use a smartphone as their main device grew overall over last year, but was especially pronounced among those in their 50’s and 60’s. This led to smartphone users making up over 90% in all age groups. Low cost carriers, which include MVNOs as well as “sub-brands” operated by the major carriers continue to increase subscribers, with customer satisfaction over the pricing and other aspects quite high.

(1) Methodology

This study has been conducted as a fixed-point observation every April since 1998 to capture on-going changes in the domestic mobile communications market and include data from the busiest sales season of the year in March.

CIAJ mailed questionnaires to 1,200 mobile phones users (100 male & 100 female users in each of the following age groups: under twenty, twenties, thirties, forties, fifties, sixties) residing in the larger Tokyo and Osaka metropolitan areas from the end of March through early April of this year.

Unique findings from this year’s study are as follows.

(2) Device Trends

<Type of device owned>

  • The 1,200 people surveyed owned a total of 1,750 devices and their breakdown is listed in the following table.
  • 1,146 respondents (95.5%) said their main-use device (primary choice device) was a smartphone, while 47 respondents (3.9%) said it was a feature phone.

    <Type of device owned by respondents of study>

    Type of device ownedNo. of devicesMain-use device
    (Primary choice)
    Smartphone1,171 (97.6%)1,146 (95.5%)
    Featurephone62 (5.2%)47(3.9%)
    Tablet (with telecom subscription)377 (31.4%)1 (0.1%)
    Tablet (with only Wi-Fi connectivity)73 (6.1%)3 (0.3%)
    Mobile Wi-Fi router66 (5.5%)0
    PHS1 (0.1%)1 (0.1%)
    No answer2 (0.2%)
    Total1,750 (145.8%)1,200 (100.0%)

<Accelerated growth of smartphone users continues>

  • The 2018 survey showed continuous growth in smartphone users with a 4.9 point increase.
  • The large increase of smartphone users among those in their 50’s and 60’s led to smartphone users making up over 90% in all age groups.

<Change in Percentage of Smartphone Users Over the Years>

<Tablets are dominant as second device>

  • 44% of the respondents were using multiple devices, increasing from 38.7% in last year’s study.
  • The rate of respondents who use tablets (with telecom subscription) was 78.7% (376 devices), tablets (with only Wi-Fi connectivity) was 14.2% (68 devices) totaling 92.9% combined.
    <Users of multiple devices>
    Users of multiple devices
    44.0%
    Uses of only one device
    56.0%
    (n=1,121)

    <Breakdown of devices used (for respondents with second device)>

<Tablets are dominant as second device, but flat growth>

  • Featurephone users decreased by 5.3 points to make up only 3.9% of respondents.
  • The decrease of featurephone users among those in their 50’s and 60’s and the increase in smartphone users in the same groups were approximately the same.

    <Change in Percentage of Featurephone Users Over the Years>

(3) User Trends Among Low Cost Carrier Services

<Low cost carrier users continues to grow>

  • 2.9% of respondents were using low cost carrier services, which includes MVNOs as well as “sub-brands (Y! mobile and UQ mobile)” operated by the major carriers (MNOs), which is an increase over last year’s 19.6%.

<MVNO Low Cost Smartphone Use>

<Satisfaction with low cost carriers>

  • Over 98% of low cost carrier users (n=263) were satisfied voice communication charges, data transmission charges, the time to on-board and contents/ease of the agreement. Other items also received high customer satisfaction ratings.

<Satisfaction After Trying Low Cost Carriers>

(4) Purchasing Cycles

<Intention to replace devices remains within expected range>

  • 65.7% of respondents indicated intention to purchase a replacement, which was 7.8 pints higher than last year. The figure has fluctuated around 70% plus or minus 10 points since 2011.
    <Intent to purchase replacement of current model>

<Purchasing cycles remains relatively unchanged>

  • The average use of respondents’ previous model (the one before the handset currently in use) was 31.2 months with the most popular response at 2 years.

<Change in Duration of Ownership>

(5) Decisive Factors for New Purchases

<Decisive factor in purchasing is price>

  • The top ranking decisive factors in purchasing the next device were “monthly payment cost,” “purchase price of device,” “water-proof,” “manufacturer/brand,” “high-speed service,” “size (snugness in one’s hand),” “long battery life” and “mobile telecom carrier.”

    <Decisive factors in purchasing new device>

(6) Use of Handset Features and Services

<Diversifying use of features and services>

  • The study has looked at the use of various features and services of mobile devices over the years. The table below indicates year-over-year change in these usage rate.
  • The use of features and services are diverse and constantly evolving. This committee is continuously reviewing the list and it is our hope that manufacturers reflect these trends in future designs of their products and services.

    <Change in use of features>

    Arrows indicate change over the previous year, with → indicating a change of 3% or less.
    – indicates an item that was not covered in the previous year’s study.

For details, contact

ICT Network & Mobile Technology Development
tel: 81-3-5403-9358 fax: 81-3-5403-9360

For more general inquiries, contact

Corporate Communications
tel: 81-3-5403-9351 fax: 81-3-5403-9360

FY2017 Data on Recycling of Mobile Phones and PHS Devices – Collected devices increases with no change in collection rate –

The Telecommunications Carrier Association (TCA) and CIAJ are working to improve the efficient use of materials in mobile phones and PHS devices through the “Mobile Recycling Network (MRN)”

As part of this endeavor, TCA, with the cooperation of mobile operators providing mobile phone and PHS services, created MRN in April, 2001, which voluntarily collects used mobile and PHS terminals, battery chargers, and batteries, mainly through the approximately 9,000 retail outlets throughout Japan, regardless of carrier or manufacturer. As of the end of FY2017, MRN had collected over 130 million devices.

Meanwhile, CIAJ established the “Environmental Assessment Guideline for Mobile and PHS Terminals,” in March, 2001 as a guideline for manufacturers to assess their products and promote the 3R activities (reduce, re-use, and recycle).

The actual figures for recycling in FY2017 are as follows.

1. Figures for Recycling and Re-Use in FY2017

(1) Figures for Recycling

FY2017FY2016FY2015FY2014
No.
collected
(1,000 terminals)
Collected
tonnage
(t)
No.
collected
(1,000 terminals)
Collected
tonnage
(t)
No.
collected
(1,000 terminals)
Collected
tonnage
(t)
No.
collected
(1,000 terminals)
Collected
tonnage
(t)
Mobile/PHS terminals6,0215815,6215645,6585656,191604
Batteries5,9151957,2391518,0611669,938203
Battery chargers1,8951352,0331372,4981653,207217

The number of mobile and PHS terminals collected in FY2017 increased from the FY2016 figure by 400,000 terminals (7%). With the popularity of smartphones, consumers are holding on to devices that they no longer use for communication purposes even after switching to another model. In addition, the market for second hand devices (re-use) has taken root. Despite these trends, we will continue to focus on collection efforts by carriers.

(2) Figures in Re-Use

Metals used in mobile and PHS terminals include steel, aluminum, magnesium, gold, silver and copper. Gold, silver, copper and palladium are refined and re-used. The slug resulting from this refining process is used for road beds and shore-line tetrapods.

Non-metallic material (plastic, glass, etc.) are also processed for recycling. Plastics are dissolved at low temperatures into resins to be made into hangers, plastic containers, toys and other every-day goods.

(3) Voluntary Numeric Targets

Since FY2009, carriers have set several numeric targets in order to further promote recycling activities. Last year’s achievements per target are listed below.

Target ItemTargetActualPrevious FY(reference)
(1) Awareness of recycling activities70%(*1)57.2%56.4%
(2) Material recycling rate70%(*2)72.9%75.8%
(3) Collection rate20%(*3)(*4)15.1%17.4%

(*1) Assessed from a survey of user awareness and behavior.
(*2) Material recycling rate of handsets for MRN (the recycling rate of metals and other materials extracted from collected terminals: excludes heat recovered materials).
(*3) Collection rate for all carriers.
Collection rate = “total number of devices of all carriers collected at licensed shops and other locations” / (“total number of subscribers who changed models at licensed shops and other locations” + “total number of mobile phone contract terminations”)
(*4)The collection target was reviewed in FY2017 with the increase in trade-ins for re-use.

The MRN collection rate declined slightly and fell below the target. This likely reflects the continuing popularity of smartphones with numerous advanced features and we can assume that when upgrading handsets or switching to a different carrier, more and more consumers continue using the older smartphones for their ability to access wireless LAN networks even after the termination of their carrier contracts. Another factor which seems to have taken root is that consumers are provided with the choice of selling their old devices for re-use when buying new models.

2. Survey on User Awareness and Behavior

An annual survey of two thousand mobile phone and PHS users was conducted to gain a better understanding of recycling perceptions and behavior.

  1. Smartphone users accounted for 67% in last year’s survey, but grew to account for 73% in this year’s survey.

  2. The survey shows that among those who changed handset models or terminated their contract in the past year, 23% returned their handsets to the retail shop, up 4% over the previous year.
    The figure for those who had returned their handsets includes people who asked the service provider shop to dispose of their terminal, those who sold their old devices, and those who gave their terminals to an acquaintance.

  3. People who returned their handsets to a store specializing in mobile handsets was the largest group at 73%. Smartphones had the highest rate of being sold or traded in, and traditional feature phones had the highest rate of being handed over for recycling.

  4. Among the respondents who have a handset(s) used for a purpose other than as a communication device, the most popular use (multiple answers possible) was “kept as part of a collection or for sentimental reasons (emotional attachment to the handset)” (25%) and “no specific reason, but want to keep the device” (23%), followed by “kept to hold on to data (photo, e-mail, contents, etc.)” (22%). The response was not very different from the previous year’s survey.
    On the other hand, 14% of respondents chose “worried about disclosing personal information” as a reason for holding on to their handsets, even after they no longer used them. 10% indicated that the reason for holding on was that they “did not know how to dispose of their handsets.” More efforts to promote MRN, especially information on such measures as data transfer, proper erasure of personal data and assistance at MRN participating retailers are still necessary.

  5. Among the respondents who have a handset(s) used for no purpose, 57% stated that they would definitely like to or might be willing to dispose the handset, if it is a feature phone and over 50% if it is a smartphone. 24% stated they definitely do not want to or rather prefer not to dispose the handset, if it is a feature phone and a much greater 29% if it is a smartphone. This indicates that there is greater reluctance to dispose of the handset if it is a smartphone and thus, a greater likelihood of keeping the device compared to feature phones. It will be necessary to continue monitoring user trends to determine if this phenomenon will continue, or if it will plateau after smartphones reach a certain saturation point.

  6. Only 20% of respondents said they had seen notices from local governments concerning how to dispose of no-longer needed mobile devices. There will be greater need to gain the cooperation from local authorities concerning the law on the recycling of small home appliances implemented on April, 2013. Of the respondents who had seen notices, the largest group said they got information through a “newsletter issued by the local government,” while others said they saw the information in a “waste disposal calendar” or “waste disposal manual” distributed by the local  government.

  7. Awareness of the recycling of mobile phones and PHS equipment, including the logo, has not made much headway, indicating the need for further efforts.
    Awareness of MRN: FY2016 (56%) FY2017 (57%)
    Recognition of logo: FY2016 (18%) FY2017 (19%)

  8. Upon showing documents on the significance of recycling handsets and introducing MRN activities, 67% of all respondents said they would definitely like to or might be willing to cooperate in collection for recycling efforts. 67% of smartphone users gave such a response, indicating the future challenge in how to link such sentiment to actual MRN collection behavior among users.

3. Measures to Improve Recycling

(1) Take steps to increase awareness

As a way to increase awareness of recycling activities by MRN, efforts will continue to provide information on websites, catalogs, manuals and billing material. Emphasis on activities such as posters introducing MRN at stores specializing in mobile handsets, stickers, pamphlets/leaflets, coverage by the press as well as working with local authorities who are responsible for trash collection will continue. In order to promote collection, we will strengthen efforts to provide guidance at specialty stores when users change models or terminate their contracts.

(2) Increasing the opportunities for collection

MRN will work closely with the “Cellular Phone Recycling Promotion Council (tentative translation)” organized by the Ministry of Internal Affairs and Communications (MIC) and composed of large-volume retailers, ICT manufacturers, telecom carriers and relevant organizations, to encourage easier consumer access to recycling, conduct appropriate protection of personal information, increase collection opportunities and raise awareness.

(3) Take measures to increase collection

  1. To increase collection rates among users who have sentimental attachments to information and data (photos, e-mail records, etc.) on their used handsets, increased support at retailers together with more information on availability of data transfer and improving the ease of backing up or transferring data stored on old models to new models will be made.
  2. In order to ease user  anxiety over leaking personal data, more effort to improving implementation and oversight of resetting or complete data erasure/destruction at specialty and retail stores (i.e. drilling a hole through the handset keyboard) will be key factors in encouraging users to feel more comfortable taking their handsets they no  longer use to MRN-participating retailers.

(4) 3R measures

  1. 9 domestic manufacturers, who are CIAJ members, conducted a FY2017 environmental assessment of mobile phones and PHS devices in March. With the increasing popularity of smartphones, manufacturers are designing the devices to be slimmer and lighter as well as enhancing their features. They are simultaneously complying to the “Environmental Assessment Guideline for Mobile and PHS Equipment” and actively promoting the 3Rs.
  2. More than ever, mobile phones and PHS devices are emphasizing enhanced features and slimmer and stylish designs with the popularity of smartphones. At the same time, there is greater interest in society about the 3Rs. With the implementation of the law on the recycling of small home appliances 5 years ago, local authorities are able to systematically collect small home appliances, including mobile phones and PHS devices. Manufacturers need to balance fulfillment of user needs with 3R responsibilities, and continue designing products based on environmental impact assessment.Manufacturers are taking their own initiatives in establishing assessment guidelines. All manufacturers are determined to continue to increase their 3R efforts for mobile phones, PHS devices, and data communication devices.


Mobile Recycling Network
URL: www.mobile-recycle.net (Japanese)

For details, contact

Products & Technologies Development
CIAJ
tel: 81-3-5403-9358

For more general inquiries, contact

Corporate Communications
CIAJ
tel: 81-3-5403-9351 fax: 81-3-5403-9360

Telecommunication Equipment Production and Trade Figures For FY2017 (April – March) – Strong domestic smartphone demand and Recovery of overseas economies boost office-use equipment and parts –

The Communication and Information network Association of Japan (CIAJ) announces the telecommunication equipment and trade figures for FY2017 April through March) as follows.

Japan’s real GDP during January through March 2018 grew YoY (year-over-year) at an annual rate of -0.6%, the first negative growth in nine quarters, according to the preliminary figures announced by the Cabinet Office on May 16th. Compared to the October – December quarter, domestic consumer spending, capital investments by the private sector and housing investments had a negative influence on the figure, but continued positive demand in overseas markets led to the real GDP for FY2017 to record positive 1.5% for the fiscal year. This reflects the overall economic climate of gradual recovery  supported by global economies and corporate performance.

The domestic telecommunication equipment market for FY2017 experienced healthy demand for smartphone upgrades, but infrastrucure equipment demand shrank, as carriers held back on capital investments. On the otherhand, in exports, multi-functioning facsimiles did well with economic recovery overseas. Domestic production of telecommunication equipment decreased again as relocation of manufacturing facilities overseas continued. Exports grew YoY as demand for parts remained healthy in conjunction with increased global production of smartphones. Demand for smartphones also played a significant role in imports, as both domestic as well as foreign brands experienced healthy growth as did other categories to result in positive YoY growth.

I. Domestic Production

(Based on Indices of Industrial Production compiled by the Ministry of Exonomics, Trade and Industry)

(1) FY2017 actual (April – March)

The total value of production in FY2017 was 518.2 billion yen, or negative 24.4% growth over FY2016. The large drop was a combined result of continued relocation of manufacturing facilities abroad as well as a slowdown in capital investments for business equipment and infrastructure equipment (wireline as well as radio) by enterprises and carriers.

(2) Trend by categories

Actual figures by categories were as follows:

  1. Wireline terminal equipment : 57.7 billion yen (-8.3% over FY2016). Of which telephone sets was 3.1 billion yen (-5.1% over FY2016), key telephones was 22.2 billion yen (-13.5% over FY2016), intercoms 31.2 billion yen (-13.5% over FY2016) and facsimiles 1.2 billion yen (-11.0% over FY2016).

  2. Mobile terminal equipment : 171.0 billion yen (-39.0% over FY2016). Of which mobile phones was 103.0 billion yen (-30.3% over FY2016) and public-use PHS 1.4 billion yen (+20.4% over FY2016). Despite the healthy demand for smartphone upgrades, domestic production of mobile phones continues to drop. On the other hand, imports of mobile phones from overseas grew to 1.971 trillion yen (+15.8% over FY2016).

  3. Wireline network equipment : 122.9 billion yen (-13.5% over FY2016). Of which switching systems was 6.2 billion yen (-29.2% over FY2016), central office switching systems was 11.9 billion yen (-25.2% over FY2016) and digital transmission equipment 38.9 billion yen (-16.0% over FY2016) and other transmission equipment was 59.8 billion yen (-4.0% over FY2016). Enterprise equipment and network equipment recorded negative growth, impacted by the supply of large to mid-sized office buildings being pushed back to FY2018. New demand is expected for key telephones, central office switching systems, facsimiles and other related equipment over the next 3 years, but the simultaneous drop in unit prices is expected to gradually push figures downwards for the overall category.

  4. Wireless network equipment : 101.8 billion yen (-26.7% over FY2016). Of which fixed telecommunication devices was 43.1 billion yen (+2.3% over FY2016) and base station equipment was 58.7 billion yen (-39.4% over FY2016). Demand for terrestrial microwave communication equipment among emerging markets abroad and successful satellite launches in Japan (including quasi-zenith satellites) contributed to positive growth for fixed telecommunication devices. The end to the most recent cycle of capital investments to accommodate faster communication speeds led to the dramatic drop in base stations.

  5. Network access equipment : 36.3 billion yen (+5.9% over FY2016). The completion of capital investments in LTE base stations for mobile networks has resulted in flat growth since FY2015.

  6. Wireline parts : 28.4 billion yen (+7.1% over FY2016). Robust demand in parts for major domestic, U.S. and Korean smart phone production recorded positive YoY growth.

II. Exports

(Compiled by CIAJ, based on based on Ministry of Finance’s “Trade Statistics”)

(1) FY2017 actual (April – March)

The total figure for exports in FY2017 (April through March) was 555.1 billion yen. The plateauing of smartphone demand in Asia in the 4th quarter translated into slower export growth, especially among smartphone parts, but the healthy domestic and overseas demand for smartphones earlier in the year was enough to lead to a 19.6% increase in exports. The export of mobile phones and terminal equipment for the U.S. market is indicating growth from FY2017. The end to the cycle in investments for LTE throughout global markets led to a significant drop in base stations in the network equipment category. In data equipment, figures declined in emerging Asian markets with the exception of China, but demand was basically flat. Robust demand in parts for major domestic, U.S. and Korean smart phone production recorded large YoY growth.

(2) Trend by categories

Actual figures by category are as follows (collection of statistics for facsimiles was terminated from January, 2018 and only include Q1 through Q3 figures):

  1. Telephone sets and terminal equipment 17.9 billion yen (+323.1% over FY2016)

    Of which, mobile phones was 15.0 billion yen (+886.2% over FY2016), facsimiles was 0.1 billion yen (―%), cordless handsets for landline phones was 0.4 billion yen (+53.9% over FY2016) and other was 2.4 billion yen (+5.3% over FY2016).

  2. Network equipment 150.4 billion yen (-5.3% over FY2016)

    Of which, base stations was 7.2 billion yen (-42.1% over FY2016), data communication equipment was 138.0 billion yen (-2.5% over FY2016) and other network equipment was 5.2 billion yen (+3.9% over FY2016).

  3. Parts (both wireline and wireless) 386.8 billion yen (28.4% over FY2016)

(3) Actual figures by region

By region, Asia was 424.5 billion yen (+22.3% over FY2016), of which China was 219.6 billion yen (+8.7% over FY2016). North America was 72.1 billion yen (+11.3% over FY2016), of which the U.S. accounted for 71.0 billion yen (+11.8% over FY2016). Europe was 41.8 billion yen (+11.6% over FY2016), of which the EU was 36.6 billion yen (+8.5% over FY2016). Exports of parts to China, which accounted for 70.5% of all exports in FY2015 and 60.3% in FY2016, dropped to 50.4% in FY2017. The production of smartphones in China has hit a ceiling and is decreasing, while production in other Asian countries continues to grow. Mobile phones to the U.S. market recorded explosive growth throughout the year, totaling 12.2 billion yen (+10,156.8% over FY2016)

(4) Comparison and breakdown by regions

First:Asia    76.5%      (+1.8% over FY2016)
Second:North America         13.0%      (-0.9% over FY2016)
Third:Europe     7.5%        (-0.6% over FY2016)
Other regions:3.0%        (-0.3% over FY2016)

III. Imports

(Compiled by CIAJ, based on based on Ministry of Finance’s “Trade Statistics”)

(1) FY2017 actual (April – March)

The total figure for exports in FY2017 (April through March) was 2.958 trillion yen, recording 12.5% YoY growth, helped by healthy domestic demand for smartphones. Positive growth in mobile phones reflected an increase in shipments of new smartphones from China to the U.S. in Q3 as well as upgrade demand before the new year. Domestic demand for LTE has tapered off, but there was positive growth in base stations and data transmission equipment. New subcategories (switching & routing equipment, other) under data transmission equipment in imports should allow more detailed understanding of switching & routing equipment market trends, such as growing emphasis in virtualization and software.

(2) Trend by categories

Actual figures by category are as follows (collection of statistics for facsimiles was terminated from January, 2018 and only include Q1 through Q3 figures):

  1. Telephone sets and terminal equipment 1.971 billion yen (+15.6% over FY2016)

    Of which, mobile phones was 1.954 trillion yen (+15.8% over FY2016), facsimiles was 3.9 billion yen (―% over FY2016), cordless handsets for landline phones was 5.9 billion yen (+14.2% over FY2016) and other was 6.5 billion yen (-6.6% over FY2016).

  2. Network equipment 676.1 billion yen (+8.5% over FY2016)

    Of which, base stations was 42.1 billion yen (+23.9% over FY2016), data communication equipment was 613.2 billion yen (+7.3% over FY2016) and other network equipment was 20.8 billion yen (+16.8% over FY2016).

  3. Parts (both wireline and wireless) 311.5 billion yen (+2.4% over FY2016)

(3) Actual figures by region

By region, Asia was 2.812 trillion yen (+13.3% over FY2016), of which China was 2.671 trillion yen (+6.7% over FY2016). North America was 75.9 billion yen (+4.4% over FY2016), of which the U.S. accounted for 73.7 billion yen (+5.7% over FY2016). Europe was 35.9 billion yen (+0.6% over FY2016), of which the EU was 34.7 billion yen (+0.6% over FY2016).

(4) Comparison and breakdown by regions

First:Asia         93.4%      (-0.8% over FY2016)
Second:North America         3.1%        (+0.3% over FY2016)
Third:Europe     2.0%        (+0.6% over FY2016)
Other regions:1.4%        (-0.2% over FY2016)

IV. Trends in Orders Received and Shipped

(from CIAJ statistics)

(1) FY2017 actual (April – March)

CIAJ statistics for total orders received and shipped amounted to 1.774 trillion yen (-3.0% over FY2016). The total value of domestic shipments totaled 1.367 trillion yen (-6.2% over FY2016) and exports was 407.4 billion yen (+9.7% over FY2016).

Orders received and shipped tallied by CIAJ =

Orders received and shipped by CIAJ domestic manufacturing members (value of domestic production + value of overseas production imported to Japan)

(2) Trend by categories

Actual figures by categories were as follows:

  1. Wireline terminal equipment : 648.3 billion yen (+2.6% over FY2016).

    Healthy performance of intercoms, office-use facsimiles for the domestic market and multi-functioning personal facsimiles for overseas markets helped push the category into positive growth.

  2. Mobile terminal equipment : 625.6 billion yen (+4.8% over FY2016).

    New product line-ups and upgrade demand pushed the entire category into positive growth.

  3. Wireline network equipment : 137.5 billion yen (-18.7% over FY2016).

    WDM transmission equipment and modems showed positive YoY growth, but the category as a whole recorded negative performance, as carriers decreased capital investments.

  4. Wireless network equipment : 284.2 billion yen (-18.8% over FY2016).

    Terrestrial communication equipment to the public sector as well as exports showed positive growth, as did demand from successful satellite launches in Jaspan. However, the completion of capital investments in LTE base stations for mobile networks resulted in a significant drop, pushing the category as a whole into negative growth.

  5. Other network equipment : 37.7 billion yen (-5.6% over FY2016).

    Both routers and LAN switches showed negative growth as demand for the public sector and carriers shrank.

  6. Parts : 40.8 billion yen (-0.5% over FY2016).

For details, contact

Market Research
CIAJ
tel: 81-3-5403-9356 fax: 81-3-5403-9360

For more general inquiries, contact

Corporate Communications
CIAJ
tel: 81-3-5403-9351 fax: 81-3-5403-9360

Study on Global Telecom Equipment Market Trends Released -Japanese Brands Targeting Promising Advanced (5G, IoT) Markets Overseas-

The Communications and Information network Association of Japan (CIAJ) announces the release of “The Study on Global Telecommunications Equipment Trends (unofficial translation: available in Japanese only).”

This Study continues to look at global business activities by Japanese manufacturers to capture changes in production and shipment figures. In the past, it has focused on the four categories of mobile phones, digital transmission equipment, base stations for mobile networks and backhaul equipment, but this year added routers and LAN equipment to capture the production and shipment landscape from a broader perspective.

1. Outline

Although the growth in global demand for telecommunication equipment continues to slow down, the popularity of smartphones is still stimulating the entire industry, with its ripple effect in investments for telecommunication infrastructure equipment to keep up with rapid rise in traffic.

On the other hand, domestic production and shipment by Japanese manufacturers have continued significant declines over the years, but last year’s CIAJ study on global telecom market statistics (2012 – 2015) in the four major categories of mobile phones, base stations for mobile networks, digital transmission equipment and backhaul equipment showed the continuation in the shift to overseas production by Japanese brands and the resulting increase in shipments from their overseas sites. This year’s study indicates that this trend has not changed.

  1. Of the total value of production (shipments) by Japanese brands, approximately 40% was produced overseas and shipped overseas (Out-Out).
  2. Of the overall Japanese market, the share of shipments by foreign brands grew and exceeded 50%.

[Diagram 1: 2016 Manufactured Goods and Flow of Shipments for the Telecom Equipment Market]
In-In: Domestic production shipped domestically
In-Out: Domestic production exported overseas
Out-In: Overseas production imported into Japan
Out-Out: Overseas production shipped overseas without going through Japan

2. Changes in the flow of production and shipments by Japanese brands in the telecom equipment market

Total Production/Shipment Figures

The total production figure for Japanese brands was 2.474 trillion yen, of which 31.6% was domestic production and the remaining 68.4% was the value of products produced abroad, indicating a 7.5% drop in the value of domestic production and 8.4% drop in overseas production. Demand for mobile phones (smartphones, feature phones), which makes up a large portion of the market, decreased in 2016, in part due to the reorganization of the domestic and overseas mobile phone business by Japanese bands, including their decision to limit the number of models they produce.

The ratio of overseas production, which had been increasing over previous years, turned around and declined by 0.2% over 2015, though the proportion of products manufactured abroad still remains high. The focus on global markets and the trend to produce locally for overseas markets continues, while companies reorganize their business focus and product lineup.

By shipment destination, 49.9% was to the domestic market and the remaining 50.1% was to overseas markets. Compared to 2015, the value of shipments to the domestic market decreased by 13.3% and shipments to overseas markets decreased by 2.2%. With the drop in shipments to the domestic market, the share of domestic brands in the Japanese market also shrank over 2015 to 48.6% and foreign brands accounted for 51.4%, reversing their positions for the first time.

[Change in Production/Shipment Figures]

In-In:

Domestic production continues to decline as the Japanese market shrinks, as seen in the -4.4%change over the 2015 figure.

In-Out:

The shipment to overseas markets from production sites in Japan took a steep drop of -18.0% over 2015. The main factor was the move to local production, local consumption, but there is also an overall decrease in the recognition of Japanese brands in global markets.

Out-In:

With the shrinking of the Japanese market, shipments from overseas manufacturing sites to Japan decreased by 21%. The figure has not changed since 2013, but with the slower demand for smartphones in 2016, the out-in for both foreign brands as well as Japanese brands declined.

Out-Out:

The out-out figure continued to exceed 1 trillion yen for the second consecutive year in 2016. This was mainly due to demand growth in global markets, especially for digital transmission equipment and backhaul equipment. The newly added category to this study, network equipment (includes routers, and LAN switches), is also following the trend of local production, local consumption.

[Diagram 2: Change in Overall Telecom Market Production and Shipment Flows]

3. Summary of Production/Shipment Flows among Japanese Brands and Challenges

The following three trends were captured in this year’s study of production and shipment figures among Japanese brands, especially with the new addition of the category covering routers and LAN switches.

  1. Taking advantage of technological competitiveness in the categories of digital transmission equipment and backhaul equipment, Japanese brands are shipping greater amounts to overseas markets than to the domestic market, regardless of the respective market sizes in Japan. With their technological advantage, Japanese brands are not only focusing on cost competitiveness in the out-out category, but also gaining shipment volume in the domestically manufactured in-out category.
  2. There is increased market entry by foreign brands in the category of base stations for mobile networks, carrier-use routers, and enterprise-use LAN switches, due in part to the openness and relatively large market size in Japan. Japanese brands are not moving towards overseas manufacturing in this category due to their comprehensive support offerings (difficult to replicate overseas) and fierce price competition in global markets, making it hard for Japanese brands to penetrate. The result is joint business initiatives with foreign brands and not producing their own products (OEM, for example).
  3. The Japanese market for enterprise-use routers and carrier-use LAN switches is smaller compared to [2], with Japanese and foreign brands carving out a roughly equal share of the market. Japanese brands are competing by actively taking advantage of the out-in production trade to minimize costs.

While network traffic is expected to increase, advances in virtualization and software technologies (SDN/NFV) will lead to base stations, routers and LAN switches in [2] to become general purpose and converge, resulting in a gradual decline in this market’s size. Thus, especially in the carrier-use categories, increased adaptation to virtual networks through joint ventures with foreign brands (multi-vendor) can be expected.

On the other hand, in [1], new business and consumer-facing physical hardware (transmission and conversion) that cannot be virtualized or switched to software-centric systems will be installed with 5th generation technologies in scope. There is optimism for new product development among high-speed compatible mobile network equipment for the last one mile for homes and offices, as well as IoT transmission equipment to enlarge the IoT monitored areas at factories and other venues that will lead to greater market size.

[Diagram 3: Production and Shipment Flows by Category]

4. Other

Lower demand in 2016 resulted in decreased shipments, for both domestic as well as overseas markets, in numerous categories, but it is evident that Japanese brands are still relying on the out-out (overseas production-shipment overseas) business model to grow their business.

This year’s study covered 8 items in 6 categories to capture three patterns of production and shipments. For example, digital transmission equipment and backhaul equipment are making their mark by using their technological advantage not only in the out-out category but also in the in-out category. In base stations for mobile networks, carrier-use routers, enterprise-use LAN switches, where rapid virtualization is becoming prevalent, Japanese brands are being impacted by foreign brands in not only the Japanese market, but overseas market as well. Enterprise-use router and carrier-use LAN switch market is currently split even with foreign brands, where Japanese brands are aggressively relying on out-in to compete.

Last year, CIAJ made clear the intent to make policy proposals in how statistics are tallied (more granular categorization of equipment type in production figures and trade figures to provide more accurate insights). To that extent, working together with the Ministry of Economy, Trade and Industry (METI), CIAJ submitted a request to the Ministry of Finance to make the equipment category used in their statistics more granular. This effort resulted in the use of “switching equipment and routing equipment” and “other (such as digital transmission equipment, modems, PON/media converters)” instead of “voice, image and other data reception, conversion, transmission and playback equipment (data telecommunication equipment).” This means that in the future, more details can be gained from import statistics (performance of foreign brands) to identify evolving market trends, such as virtualization and switch to software centric systems in “switching equipment and routing equipment.”

CIAJ will continue to support business activities, including global initiatives, of Japanese brands through our statistical efforts, pursuing better ways of understanding new global market developments and more accurately grasping market trends, such as 5G and IoT.

For details, contact

Market Research
CIAJ
tel: 81-3-5403-9356 fax: 81-3-5403-9360

For more general inquiries, contact

Corporate Communications
CIAJ
tel: 81-3-5403-9351 fax: 81-3-5403-9360