The Communication and Information network Association of Japan (CIAJ) announces the telecommunication equipment and trade figures for October through December, 2018 as follows.
According to the Monthly Economic Report announced by the Cabinet Office on February 21, consumer spending and capital investments in the private sector is indicating a gradual recovery after the drop stemming from the natural disasters over the past year. However, the slowdown of the Chinese economy has led to a negative forecast in manufacturing and coporate profits, with overseas demand, especially in semi-conductors and parts for smart phones and assemblyline equipment, losing momentum.
Looking specifically at the telecom market, domestic capital investments in potential growth areas, such as network equipment for 5G and IoT service, is about to begin, but exports are declining with the slowdown of the Chinese economy and the resulting drop in demand for smartphone parts. The domestic market value saw a drop in demand for handsets, but exceded the figure for FY2016 QIII.
I. Domestic Market Trends (new category)
(Aggregated by CIAJ based on Indices of Industrial Production and Trade Statistics of Japan)
(1) FY2018 QIII actual
The size of the domestic market (including the value of imports of foreign brands) was calculated from government figures, the Indices of Industrial Production and Trade Statistics of Japan, according to the following formula:
Domestic market size = value of domestic production – value of exports + value of imports
The total value of the domestic market for October through December was 964.6 billion yen, or negative 8.9% growth over the same quarter in FY2017.
(2) Trend by categories
Actual figures by category for October through December were as follows:
Terminal equipment
746.0 billion yen (-13.8% over the same quarter of the previous year).Network equipment
218.6 billion yen (+13.2% over the same quarter of the previous year).
Domestic Market (by categories/quarter)

II. Domestic Production
(Based on Indices of Industrial Production compiled by the Ministry of Economics, Trade and Industry)
(1) FY2018 QIII actual
The total value of production was 108.0 billion yen, or negative 9.0% growth over the same quarter in FY2017. Production of telephone sets targeting consumers, as well as key telephones and PBXs for enterprise use, wireline digital transmission equipment and network access equipment all showed positive growth, contibuting to minimize the drop in domestic production.
(2) Trend by categories
Actual figures by category for October through December were as follows:
Wireline terminal equipment
13.6 billion yen (+7.7% over the same quarter of the previous year). Of which telephone sets was 800 million yen (+23.9% over the same quarter of the previous year) and key telephones 3.9 billion yen (+9.2% over the same quarter of the previous year), intercoms 8.5 billion yen (+4.9% over the same quarter of the previous year) and facsimiles 400 million yen (+30.0% over the same quarter of the previous year). All categories indicated positive year-over-year growth.
Mobile terminal equipment
29.2 billion yen (-22.0% over the same quarter of the previous year). Of which mobile phones was 16.0 billion yen (-31.2% over the same quarter of the previous year) and public-use PHS 200 million yen (-28.6% over the same quarter of the previous year). Demand for mobile phones declined, as consumers opt to wait for the anticipated separation of device cost from monthly charges.
Wireline network equipment
29.8 billion yen (+0.3% over the same quarter of the previous year). Of which central office switching systems was 1.7 billion yen (-28.5% over the same quarter of the previous year), PBXs was 2.0 billion yen (+8.0% over the same quarter of the previous year) and digital transmission equipment was 9.8 billion yen (+7.1% over the same quarter of the previous year) and other transmission equipment was 14.5 billion yen (-1.9% over the same quarter of the previous year). Overseas and domestic demand for central office switching systems grew. Enhancement of communication network facilities to handle spiking data traffic led to demand growth for digital transmission equipment.
Wireless network equipment
18.3 billion yen (-20.2% over the same quarter of the previous year). Of which fixed telecommunication devices was 8.6 billion yen (-0.8% over the same quarter of the previous year) and base station equipment was 9.6 billion yen (-32.1% over the same quarter of the previous year). Private sector demand for microwave communication equipment and government demand for emergency/ MCA radio base station grew, but was not enough to cover the decline in base stations for mobile networks.
Network access equipment
9.7 billion yen (+12.8% over the same quarter of the previous year). Demand for data center LAN switches pushed the entire figure up for the category.
Wireline parts (includes relay equipment for wireline systems)
7.5 billion yen (+0.1% over the same quarter of the previous year). The slowdown of the Chinese economy resulted in the decline in production of smartphone parts.
III. Exports
(Compiled by CIAJ, based on based on Ministry of Finance’s “Trade Statistics”)
(1) FY2018 QIII actual
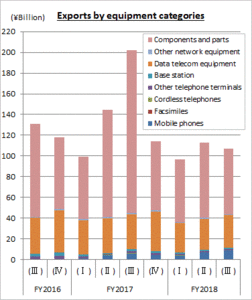
The total figure for exports for October through December was 106.6 billion yen, or -46.9% over the same quarter of the previous year. The slowdown of the Chinese economy resulted in the decline in production of smartphone parts and thus, the drop in the export of parts.
The figure for data communication equipment also took a hit from the slowdown of the Chinese economy. In telephone and handsets, the export of mobile phones to the U.S. has continued recording positive YoY growth since 2017 QII.
(2) Trend by categories
Actual figures from October through December by category are as follows (the facsimile category is no longer indicated from January 2018):
- Telephone sets and terminal equipment 9.3 billion yen (+44.0% over the same quarter of the previous year)
Of which, mobile phones was 8.7 billion yen (+52.1% over the same quarter of the previous year), cordless handsets for landline phones was 60 million yen (-38.5% over the same quarter of the previous year), and other was 500 million yen (-16.3% over the same quarter of the previous year). - Network equipment 33.8 billion yen (-9.2% over the same quarter of the previous year)
Of which, base stations was 1.2 billion yen (-42.3% over the same quarter of the previous year), data communication equipment was 31.7 billion yen (-6.6% over the same quarter of the previous year) and other network equipment was 900 million yen (-23.8% over the same quarter of the previous year). - Parts (both wireline and wireless) 63.5 billion yen (-59.6% over the same quarter of the previous year)
(3) Actual figures by region
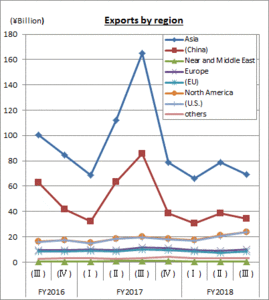
By region, Asia was 69.0 billion yen (-58.2% over the same quarter of the previous year), of which China was 34.3 billion yen (-60.0% over the same quarter of the previous year). North America was 23.9 billion yen (+20.4% over the same quarter of the previous year), of which the U.S. was 23.6 billion yen (+20.0% over the same quarter of the previous year). Europe was 9.8 billion yen (-16.3% over the same quarter of the previous year), of which the EU was 8.5 billion yen (-16.2% over the same quarter of the previous year).
ThThe export to China significantly dropped for the second quarter in a row to -60.0% over the previous year. The export of mobile phones to the U.S. was 8.0 billion yen (+62.7% over the same quarter of the previous year) and has recorded positive growth since 2017 QII.
(4) Comparison and breakdown by regions
| First: | Asia | 64.7% (-4.7% over the same quarter of the previous year) |
| Second: | North America | 22.5% (+4.2% over the same quarter of the previous year) |
| Third: | Europe | 9.2% (+0.4% over the same quarter of the previous year) |
| Other regions: | 3.6% (+0.1% over the same quarter of the previous year) |
IV. Imports
(Compiled by CIAJ, based on based on Ministry of Finance’s “Trade Statistics”)
(1) FY2018 QIII actual
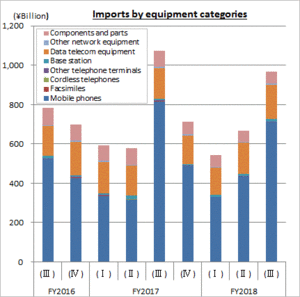
The total figure for exports from October through December was 968.0 billion yen (-9.8% over the same quarter of the previous year). Domestic demand for mobile phones (import of both Japanese brands manufactured abroad and foreign brands) was low, as consumers show signs of waiting for the anticipated separation of device cost from monthly charges. Demand for network equipment is showing signs of picking up, with investments in network facilities.
(2) Trend by categories
Actual figures by category for October through December are as follows (the facsimile category is no longer indicated as of January 2018):
- Telephone sets and terminal equipment 712.6 billion yen (-13.1% over the same quarter of the previous year)
Of which, mobile phones was 709.5 billion yen (-13.2% over the same quarter of the previous year), cordless handsets for landline phones was 1.3 billion yen (-31.5% over the same quarter of the previous year) and other was 6.7 billion yen (+27.3% over the same quarter of the previous year). - Network equipment 173.6 billion yen (+12.1% over the same quarter of the previous year)
Of which, base stations was 14.3 billion yen (+60.5% over the same quarter of the previous year), data communication equipment was 173.6 billion yen (+12.1% over the same quarter of the previous year) and other network equipment was 6.7 billion yen (+27.3% over the same quarter of the previous year). - Parts (both wireline and wireless) 60.8 billion yen (-27.7% over the same quarter of the previous year).
(3) Actual figures by region
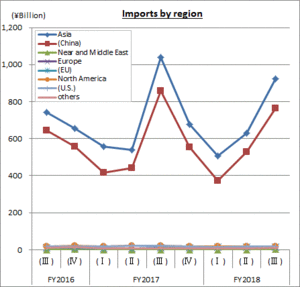
By region, Asia was 923.4 billion yen (-10.9% over the same quarter of the previous year), of which China was 763.4 billion yen (-10.8% over the same quarter of the previous year). North America was 19.0 billion yen (-5.3% over the same quarter of the previous year), of which the U.S. accounted for 17.6 billion yen (-10.0% over the same quarter of the previous year). Europe was 13.3 billion yen (+42.2% over the same quarter of the previous year), of which the EU was 12.9 billion yen (+40.6% over the same quarter of the previous year).
The import of mobile telephones from China in QIII declined by 11.9% year over year, dropping dramatically by 50.6% in December alone.
(4) Comparison and breakdown by regions
| First: | Asia | 95.4% (+1.8% over the same quarter of the previous year) |
| Second: | North America | 2.0% (-0.8% over the same quarter of the previous year) |
| Third: | Europe | 1.4% (-0.9% over the same quarter of the previous year) |
| Other regions: | 1.2% (-0.1% over the same quarter of the previous year) |
V. Trends in Orders Received and Shipped
(from CIAJ statistics)
(1) FY2018 QIII actual
CIAJ statistics for total orders received and shipped amounted to 386.9 billion yen (-16.8% over the same quarter of the previous year) for the quarter. Of which the total value of domestic shipments totaled 300.2 billion yen (-15.7% over the same quarter of the previous year) and exports was 86.7 billion yen (-20.6% over the same quarter of the previous year).
CIAJ statistics for total orders received and shipped = orders received and shipped by CIAJ member companies
(total orders received and shipped = value of shipments for the domestic market (domestic production + foreign production) = value of domestic production + value of imports of products produced abroad)
(2) Trend by categories
Actual figures by category for October through December were as follows:
- Wireline terminal equipment
134.2 billion yen (-10.5% over the same quarter of the previous year).
Domestic demand for telephone sets and other indicated positive growth, but the economic slowdown abroad resulted in negative exports of personal and office-use facsimiles (including multi-functioning devices. - Mobile terminal equipment
142.5 billion yen (-21.0% over the same quarter of the previous year).
Lower domestic demand for newer models resulted in negative growth. Among other mobile equipment, MCA/simple radio terminals showed healthy growth. - Wireline network equipment
46.0 billion yen (+3.4% over the same quarter of the previous year).
The positive figure was led by growth in key telephones and digital transmission equipment. - Wireless network equipment
45.9 billion yen (-38.0% over the same quarter of the previous year).
Demand for microwave communication equipment and base stations for emergency and MCA radio networks was positive, but demand for the category as a whole experienced a significant drop, as base stations for mobile communication networks remained low. - Other network equipment
9.6 billion yen (+0.5% over the same quarter of the previous year).
Positive growth resulted from healthy demand for data center equipment, such as LAN switches. - Communication equipment parts
8.6 billion yen (-17.9% over the same quarter of the previous year).
For details, contact
Market Research
CIAJ
tel: 81-3-5403-9356 fax: 81-3-5403-9360
For more general inquiries, contact
Corporate Communications
CIAJ
tel: 81-3-5403-9351 fax: 81-3-5403-9360


