The Communication and Information network Association of Japan (CIAJ) announces the telecommunication equipment production and trade figures for FY2019 (April-March) as follows.
I. Overview
In the January-March quarter of 2020, the Japanese economy recorded an annualized quarter-over-quarter real GDP growth of minus 3.4% (first preliminary estimate released on May 18), negative growth for the second consecutive quarter. Private consumption declined due to stay-at-home requests to contain the spread of the coronavirus before it recovered from a fall following the consumption tax hike. Capital investment was postponed because of sluggish construction work and machine production in the second half of the fiscal year and decreased. Exports fell, reflecting a slowdown in the world economy, and imports slipped chiefly due to sluggish domestic demand.
Looking specifically at the telecom market, demand for smartphones fell primarily due to a wait-and-see situation before and after the revision to the Telecommunications Business Act, a decline in purchase motivations mainly because of the spread of the coronavirus, and a slowdown in purchases before launches of 5G (fifth-generation mobile communication systems) terminals, despite the increased replacement of traditional feature phones. Meanwhile, in anticipation of an increase in data traffic due to the use of 5G, demand for equipment related to wireline networks, backbone systems, increased. Demand for mobile phone infrastructure equipment, including base stations and routers, is increasing.
(1) Domestic Market Trends
In FY2019, the total value of the domestic market (value of domestic production – value of exports + value of imports; excluding parts) stood at 2,700.5 billion yen, down 7.4% year over year. This reflected a decrease in imports of domestic-brand mobile phones manufactured overseas and foreign-brand ones.
(2) Domestic Production
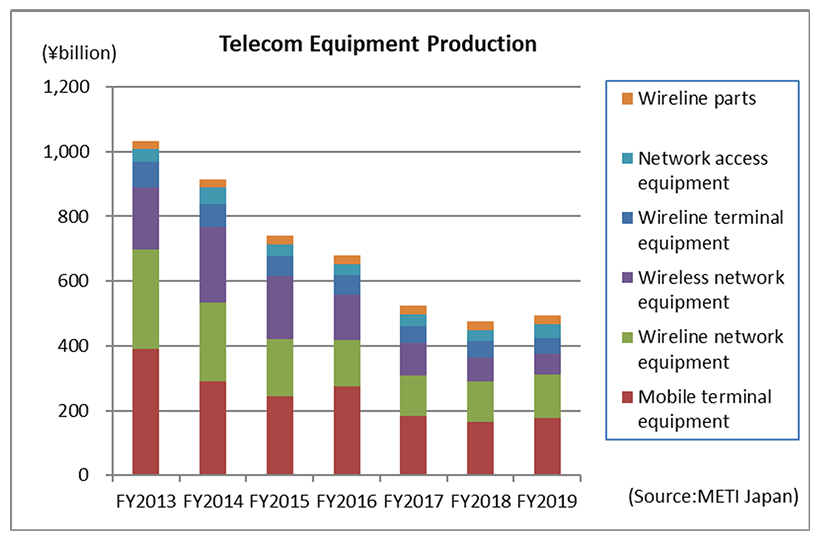
The total value of domestic production in FY2019 was 493.1 billion yen, an increase of 3.8% over FY2018. Domestic production rose year over year for 10 consecutive months and annual domestic production increased year over year for the first time in 14 years, since FY2005 due to strong demand for digital transmission equipment and network access equipment in anticipation of an increase in data traffic and solid exports of commercial radio terminals and other mobile terminals.
(3) Exports
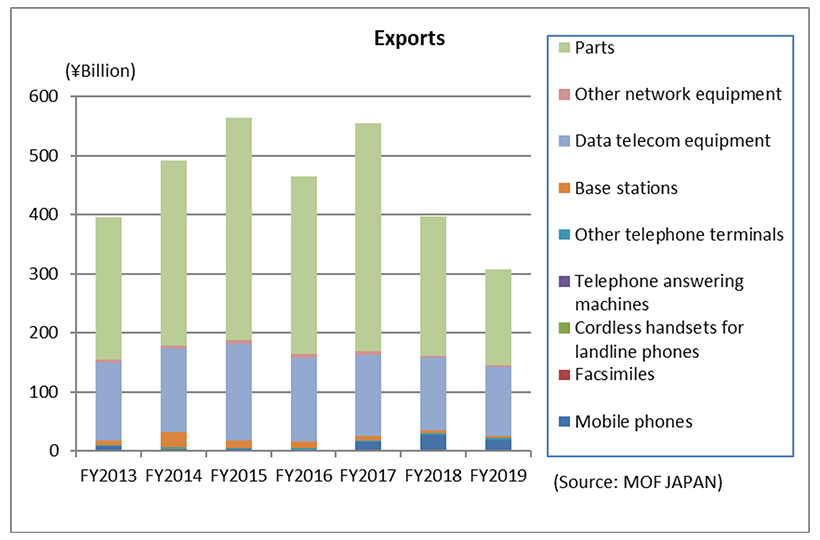
The total figure for exports in FY2019 was 307.4 billion, a decrease of 22.7% over FY2018, falling significantly for the second consecutive year and the ninth consecutive quarter. Exports in almost all categories, particularly parts used in the production of smartphones, decreased, reflecting a continued slowdown in the world economy.
(4) Imports
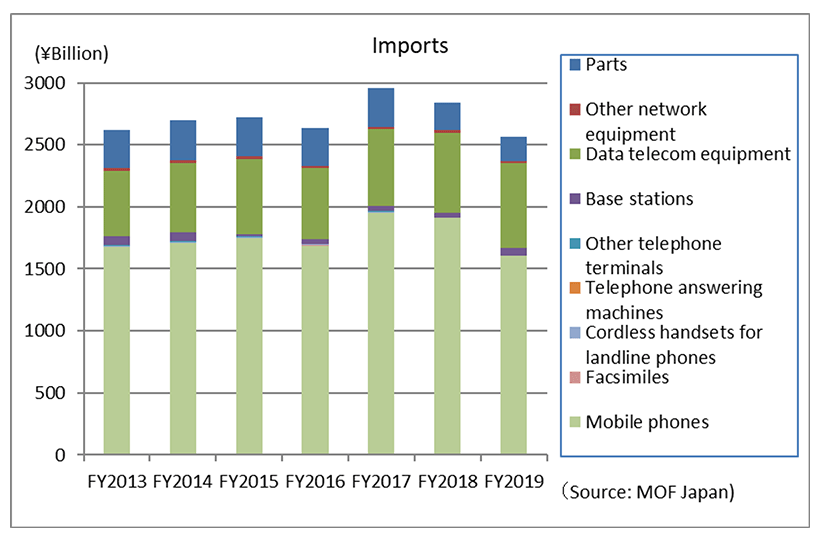
The total figure for imports in FY2019 was 2,578.3 billion yen, a decrease of 9.6% over FY2018, falling for the second consecutive year and the third consecutive quarter. Imports of domestic-brand mobile phones manufactured overseas and foreign-brand ones dropped significantly due to a decrease in demand for smartphones in Japan. Meanwhile, imports for the development of 5G base stations grew.
II. Domestic Market Trends
(Aggregated by CIAJ based on Indices of Industrial Production and Trade Statistics of Japan)
(1) Detailed trends by category
Actual figures by category for FY2019 are as follows. Network equipment continued to grow.
Terminal equipment 1,824.2 billion yen (-13.6% over FY2018)
- Network equipment 877.3 billion yen (+9.0% over FY2018)
The size of the domestic market (including the value of imports of foreign brands) was calculated from government figures, the Indices of Industrial Production and Trade Statistics of Japan, according to the following formula:
Domestic market size = value of domestic production – value of exports + value of imports
III. Domestic Production
(Based on Indices of Industrial Production compiled by the Ministry of Economics, Trade and Industry)
(1) Wireline terminal equipment
Actual figures by category in FY2019 were as follows (the statistics from January 2018 to December 2019 were revised, and the statistics particularly for mobile phones change):
Wireline terminal equipment
49.0 billion yen (-5.1% over FY2018).
Of this, telephone sets was 2.0 billion yen (-38.6% over FY2018), key telephones 14.1 billion (-12.3%), and intercoms 33.0 (+1.9%). Private consumption and business spending were sluggish in the latter half of the fiscal year due to the consumption tax hike and the spread of the coronavirus, and domestic production of equipment for household use and business use declined.Mobile terminal equipment
176.0 billion yen (+6.8% over FY2018). Of which, mobile phones (including public-use PHS) was 107.6 billion yen (-6.5% over FY2018).
Of this, mobile phones manufactured in Japan fell, while other land telecommunication devices, including commercial/simple radio telecommunication devices, rose.Wireline network equipment
134.3 billion yen (+8.5% over FY2018). Of which, central office switching systems was 9.0 billion yen (+1.7% over FY2018), PBXs was 5.5 billion yen (-24.7% over FY2018), digital transmission equipment was 48.8 billion yen (+13.1% over FY2018) and other transmission equipment was 63.9 billion yen (+9.7% over FY2018).
PBXs declined due to the economic slowdown, which resulted in a reduced willingness for capital expenditure, as well as the consolidation of bases of companies and a reduction in the number of lines resulting from FMC. Meanwhile, in central office switching systems, demand for accommodation and conversion equipment that is necessary for the transition from public switched telephone networks to IP networks increased. Domestic production and exports of digital transmission equipment rose, reflecting telecom companies’ investment in metro networks in response to increasing data traffic.Wireless network equipment
64.9 billion yen (-11.2% over FY2018). Of which, fixed telecommunication devices ware 29.1 billion yen (-12.8% over FY2018) and base station equipment was 35.8 billion yen (-9.9% over FY2018).
Network access equipment
43.0 billion yen (+32.9% over FY2018).
Demand increased, chiefly reflecting the strengthening of network systems for commercial 5G services, the handling of increasing data traffic for video services, and the development of office networks in response to the spread of the coronavirus.Wireline parts (includes relay equipment for wireline systems)
25.9 billion yen (-12.0% over FY2018).
Exports of parts used in the production of smartphones in emerging countries declined, and production of parts continued.
IV. Exports
(Compiled by CIAJ, based on based on Ministry of Finance’s “Trade Statistics”)
(1) Detailed trends by category
Actual figures by category for FY2019 are as follows:
Telephone sets and terminal equipment 22.0 billion yen (-26.2% over FY2018)
Of this, mobile phones was 19.1 billion yen (-29.3% over FY2018), cordless handsets for landline phones was 0.3 billion yen (-12.5% over FY2018), and other was 2.6 billion yen (+6.5% over FY2018). Exports of mobile phones to the United States fell, and exports of commercial radio terminals, etc. including in the other category to the U.S. increased.
Network equipment 123.5 billion yen (-5.5% over FY2018)
Of this, base stations was 2.5 billion yen (-43.3% over FY2018), data communication equipment was 117.3 billion yen (-4.4% over FY2018), and other network equipment was 3.7 billion (+6.6% over FY2018). Demand continued to decline due to the slowdown in the world economy, but exports of other network equipment to countries in Asia rose.
Parts (both wireline and wireless) 161.9 billion yen (-31.7% over FY2018)
Exports of parts used in the production of smartphones continued to fall due to the sluggish production of smartphones in emerging countries in Asia because of declining demand and production stoppage caused by the spread of the coronavirus.
(2) Detailed trends by region
A breakdown of results for FY2019 by region shows that Asia was 184.5 billion yen (-29.4% over FY2018), of which China was 60.0 billion yen (-50.9% over FY2018). North America was 70.3 billion yen (-15.5% over FY2018), of which the U.S. was 69.5 billion yen (-15.4% over FY2018). Europe was 41.2 billion yen (+7.0%), of which the EU was 33.8 billion yen (+0.4%). The percentage of exports to China to total exports decreased to 19.5% due to the large impact of a fall in exports of parts used in the production of smartphones.
(3) Comparison and breakdown by regions
| First: | Asia | 60.0% (-5.7% over FY2018) |
| Second: | North America | 22.9% (+1.9% over FY2018) |
| Third: | Europe | 13.4% (+3.7% over FY2018) |
| Other regions | 3.7% (+0.1% over FY2018) |
V. Imports
(Compiled by CIAJ, based on based on Ministry of Finance’s “Trade Statistics”)
(1) Detailed trends by category
Actual figures by category for FY2019 are as follows.
(the statistics from January 2019 to December 2019 were revised.)
Telephone sets and terminal equipment 1,621.2 billion yen (-15.7% over FY2018)
Of this, mobile phones was 1,609.8 billion yen (-15.8% over FY2018), cordless handsets for landline phones was 4.5 billion yen (-11.4% over FY2018) and other was 6.9 billion yen (+2.9% over FY2018). Imports of domestic brands manufactured overseas and foreign brands decreased mainly due to the coronavirus. Imports of video conference and conference call systems, which are included in the other category, from Asian countries rose.
Network equipment 757.6 billion yen (+7.4% over FY2018)
Of this, base stations was 62.4 billion yen (+51.7% over FY2018), data communication equipment was 676.5 billion yen (+5.8% over FY2018) and other network equipment was 18.7 billion yen (-24.8% over FY2018). Of data communication equipment, switching and routing equipment was 369.6 billion yen (+2.2%) and other data communication equipment (including transmission devices, communication devices and modems) was 306.9 billion yen (+10.4%). Imports related to base stations for the development of mobile phone infrastructure increased significantly.
Parts (both wireline and wireless) 199.5 billion yen (-10.3% over FY2018)
(2) Detailed trends by region
A breakdown of results for FY2019 by region shows that Asia was 2,413.1 billion yen (-10.2% over FY2018), of which China was 1,901.9 billion yen (-13.3% over FY2018). North America was 68.6 billion yen (-0.3% over FY2018), of which the U.S. accounted for 64.8 billion yen (+1.1%). Europe was 50.3 billion yen (-6.9% over FY2018), of which the EU was 49.1 billion yen (-7.5% over FY2018). Asia accounted for almost all imports related to base stations, which doubled year over year.
(3) Comparison and breakdown by regions
| First: | Asia | 93.6% (+0.6% over FY2018) |
| Second: | North America | 2.7% (+0.3% over FY2018) |
| Third: | Europe | 1.9% (±0 % over FY2018) |
| Other regions | 1.8% (+0.3% over FY2018) |
VI. Trends in Orders Received and Shipped
(1) FY2019 actual
CIAJ statistics for total orders received and shipped in FY2019 amounted to 1,501.1 billion yen, down 4.8% over FY2018. Of this, the total value of domestic shipments was 1,208.7 billion yen, a decrease of 2.9% over FY2018. The total value of exports was 292.3 billion yen, a fall of 12.0% over FY2018.
Domestic shipments decreased year over year due to a significant fall in shipments of mobile terminal equipment, despite a rise in shipments of other equipment.
*CIAJ statistics for total orders received and shipped = orders received and shipped by CIAJ member companies.
(=value of shipments for the domestic market (domestic production + foreign production) + value of exports = value of domestic production + value of imports of products produced abroad)
(2) Trend by categories
Actual domestic shipments and exports by category for FY2019 were as follows:
Wireline terminal equipment
532.0 billion yen (-3.6% over FY2018).
Domestic demand for IP telephone sets in response to the transition to IP, intercoms, and video intercoms was strong. However, exports of office-use facsimiles (including multi-functioning devices) fell significantly due to the slowdown in the world economy. Overall results of wireline terminal equipment declined year over year.Mobile terminal equipment
453.4 billion yen (-16.6% over FY2018)
Although exports of other mobile terminal equipment were favorable, demand for mobile phones dropped. In addition, mobile phones that sold well shifted from high-end phones to mid-range models, and the unit price fell. Results of Mobile terminal equipment thus declined.Wireline network equipment
212.8 billion yen (+7.7% over FY2018)
Although key telephones and PBXs declined due to sluggish capital expenditure at companies, domestic demand and exports of digital transmission equipment were strong. Domestic demand for PON (ONU/OLT) was also favorable. The overall results of wireline network equipment rose year over year.Wireless network equipment
231.0 billion yen (+10.6% over FY2018)
As demand for mobile telephone infrastructure equipment is rising, shipments of base station-related equipment for domestic manufacturers fell year over year. However, demand for terrestrial fixed communication equipment for government offices and the private sector and satellite fixed communication equipment for government offices increased significantly. As a result, overall results rose year over year.Other network equipment
44.5billion yen (+7.9% over FY2018)
Results rose year over year, reflecting strong demand for routers and LAN switches. LAN switches both for telecom companies and for other entities in the private sector rose significantly.Communication equipment parts
27.4 billion yen (-19.9% over FY2018)


