I. Summary
In October through December 2020, the Japanese economy was on a recovery trend, continuing to grow significantly following real GDP growth (annual growth rate of 22.7%) in the previous quarter, a reaction to the adverse impact of the COVID-19 pandemic, with an annual real GDP growth rate of 12.7% (first preliminary figures: February 25). However, real GDP has not yet returned to the level before the sharp fall caused by the pandemic. In the 2020 calendar year, the real GDP growth rate was -4.8%, the first negative growth in the 11 years since 2009.
In these circumstances, in October through December, capital expenditure continued to increase in the telecommunication equipment market, in line with the construction of 5G communication infrastructure and the nationwide development of optical cable networks which have been unaffected by the COVID-19 pandemic. Demand for mobile phones, which had declined due to COVID-19, and business-related devices, for which sales activities were weak and capital expenditures were curbed, is recovering.
(1) Domestic Market Trends
The domestic market value (domestic production value – export value + import value, excluding components; imports including products made by overseas manufacturers) amounted to 980.1 billion yen in the October-through-December period, a year-on-year increase of 19.4%. Demand for terminal equipment is increasing and returning to the level of two years ago. The cumulative total market size from April through December was 2,144.5 billion yen, up 5.8% year-on-year.
(2) Domestic Production Trends
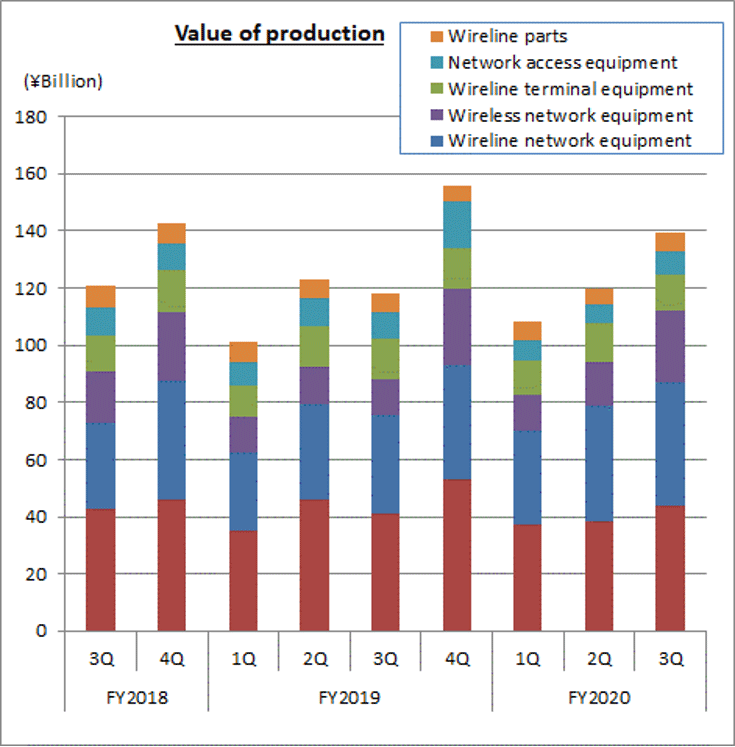
Domestic production totaled 137.3 billion yen in October through December, a year-on-year increase of 17.8%. Domestic production increased for the first time in two quarters, reflecting a recovery in buyers’ motivation to buy mobile phones, which was previously weak, and a significant increase in capital expenditure, including investment in 5G base stations. The cumulative total from April to December stood at 359.7 billion yen, up 5.8% year-on-year.
(3) Export Trends
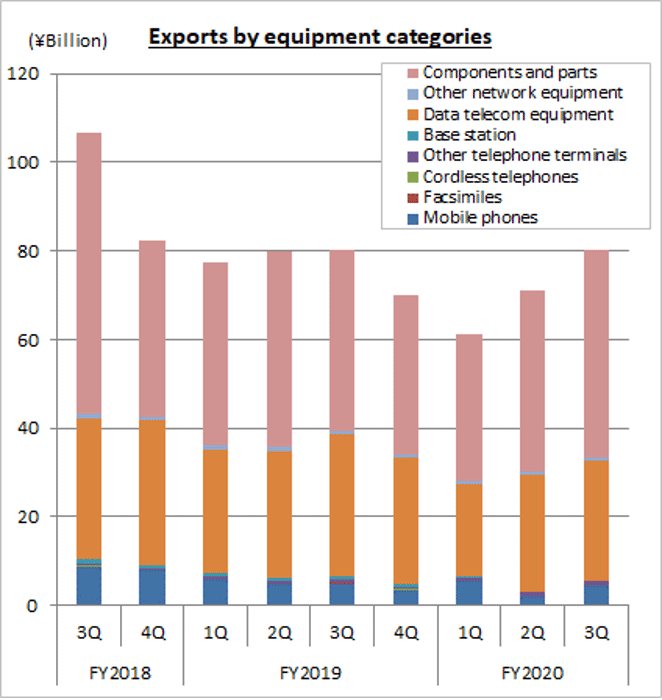
Total exports amounted to 80.3 billion yen for October through December, a slight year-on-year increase of 0.1%. Smartphone production in emerging countries in Asia recovered and exports of components for smartphone production is increasing. As a result, exports increased for the first time in 12 quarters. In total from April to December, the figure dropped by 10.5% year-on-year to 212.5 billion yen, reflecting a decrease in exports of equipment other than components of smartphones due to the continued slowdown in overseas economies.
(4) Import Trends
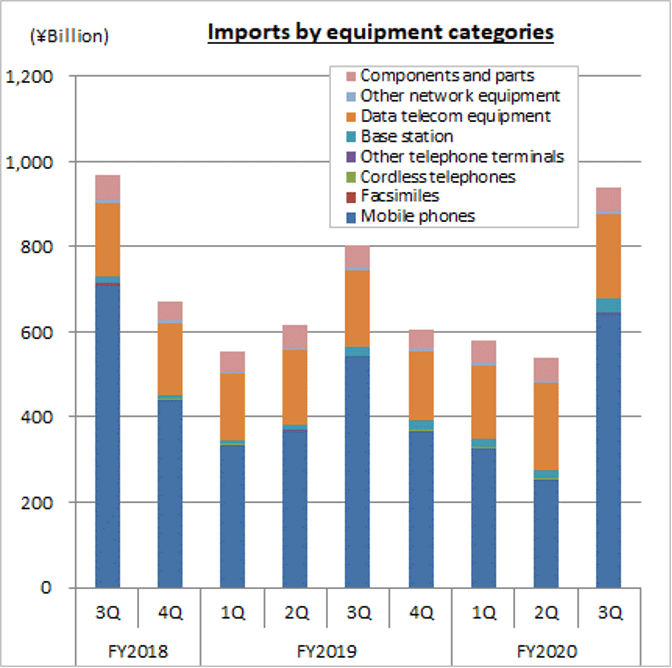
In the October-through-December period, total imports amounted to 939.6 billion yen, a 17.0% increase year on year. Imports increased for the first time in two quarters, reflecting continued strong domestic demand related to networks, including demand for base stations and equipment in the “other (transmission equipment, communications equipment, modem, etc.)” category in data communications equipment and a recovery in demand for mobile phones, which account for a large percentage of the total value of imports. The total from April to December stood at 2,059.8 billion yen, up 4.4% year-on-year.
II. Domestic Market Trends
(Aggregated by CIAJ based on Indices of Industrial Production and Trade Statistics of Japan)
(1) Detailed trends by category
Actual figures by category for October through December are as follows. Both network equipment and terminal equipment grew.
The size of the domestic market (including the value of imports of foreign brands) was calculated from government figures, the Indices of Industrial Production and Trade Statistics of Japan, according to the following formula: Domestic market size = value of domestic production – value of exports + value of imports
Terminal equipment : 693.8 billion yen (+17.2% over the same period of the previous year)
Network equipment : 286.3 billion yen (+25.1% over the same period of the previous year)
III. Domestic Production
(Based on Indices of Industrial Production compiled by the Ministry of Economics, Trade and Industry)
(1) Detailed trends by category
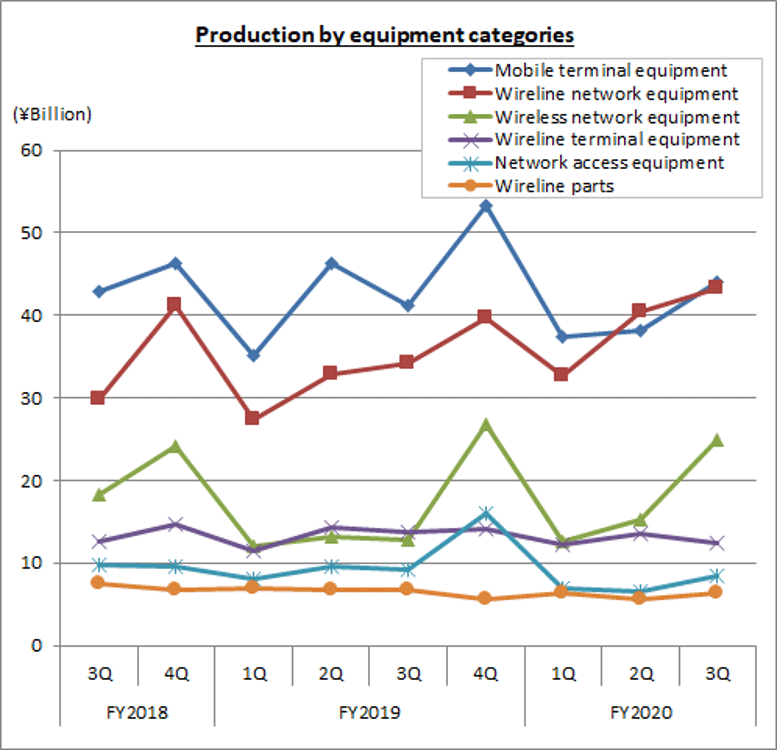
Actual figures by category for October through December are as follows.
Wireline terminal equipment
10.5 billion yen (-15.5% over the same quarter of the previous year). Of this, telephone sets were 0.5 billion yen (-11.0% over the same period of the previous year), key telephones 3.2 billion yen (-6.0%), and intercoms 6.8 billion yen (-19.5%). Demand for intercoms for homes and key telephones for office buildings were weak due to the restriction of face-to-face sales and installation work and a decrease in construction starts because of the COVID-19 pandemic. Although production is recovering from the decline caused by COVID-19, domestic production decreased.
Mobile terminal equipment
44.0 billion yen (+6.7% over the same quarter of the previous year). Of which, mobile phones were 27.8 billion yen (+8.0% over the same quarter of the previous year). Although mobile phones were adversely affected by the COVID-19 pandemic, they are on a recovery trend. Sales of new products, including 5G models, were strong, and domestic production increased.
Wireline network equipment
43.2 billion yen (+26.1% over the same quarter of the previous year). Of which, central office switching systems was 4.6 billion yen (+62.0% over FY2019), PBXs was 1.0 billion yen (-23.3% over FY2019), digital transmission equipment was 18.3 billion yen (+52.1% over FY2019) and other transmission equipment was 17.1 billion yen (+5.3% over FY2019). In central office switching systems, production of equipment for conversion to IP telephony increased, reflecting the migration of fixed line telephones to IP telephony networks. PBXs are recovering from the decline caused by a decrease in opportunities to use fixed line telephones and a reduction in offices due to the increase of people working from home, but domestic production of PBXs decreased. Domestic production of digital transmission equipment continues to increase significantly due to strong investment in backbone network equipment, in line with the construction of 5G telecommunication infrastructure and the nationwide development of optical cable networks.
Wireless network equipment
24.9 billion yen (+94.4% over the same quarter of the previous year). This includes 6.9 billion yen (down 5.5% year on year) for fixed telecommunication devices and 18.1 billion yen (up 185.4% year on year) for base station communication equipment. Domestic production of fixed communications equipment rose, reflecting firm production for government offices. Domestic production of base station communications equipment is increasing significantly for the construction of 5G communication infrastructure.
Network access equipment
8.4 billion yen (-8.7% over the same quarter of the previous year). Demand for routers for telecommunications carriers is firm on the back of an increase in traffic due to teleworking and online meetings. Domestic production of LAN switches decreased year on year due to weak capital expenditure at companies because of the COVID-19 pandemic and a decline in demand, despite a recovery in demand owing to the GIGA School Initiative, primarily because of the extension of installation work.
Wireline parts (relays and repeaters for wired equipment)
6.3 billion yen (-4.8% over the same quarter of the previous year). The year-on-year decline was reduced due to a recovery in the production of smartphones in emerging countries in Asia.
IV. Exports
(Compiled by CIAJ, based on Ministry of Finance’s “Trade Statistics”)
(1) Detailed trends by category
Actual figures by category from October to December are as follows:
Telephone sets and terminal equipment 5.4 billion yen (-5.3% over the same period of the previous year)
Of this, mobile phones were 4.3 billion yen (-12.0% over FY2019), cordless handsets for landline phones were 0.06 billion yen (-15.5% over FY2019), and other was 1.0 billion yen (+44.0% over FY2019). Exports of telephone sets and terminal equipment, including video phones, to the United States continued to increase.
Network equipment 28.1 billion yen (-16.5% over the same period of the previous year)
Of which, base stations were 200 million yen (-74.6% over the same quarter of the previous year), data communication equipment was 27.1 billion yen (-15.2% over the same quarter of the previous year) and other network equipment was 800 million yen (-7.7% over the same quarter of the previous year). Exports were sluggish due to a decrease in almost all equipment caused by a slowdown in overseas economies.
Parts (both wireline and wireless) 46.9 billion yen (+14.5% over the same period of the previous year)
Smartphone production in emerging countries in Asia recovered and exports of components for smartphone production increased. As a result, exports increased for the first time in 10 quarters.
(2) Detailed trends by region
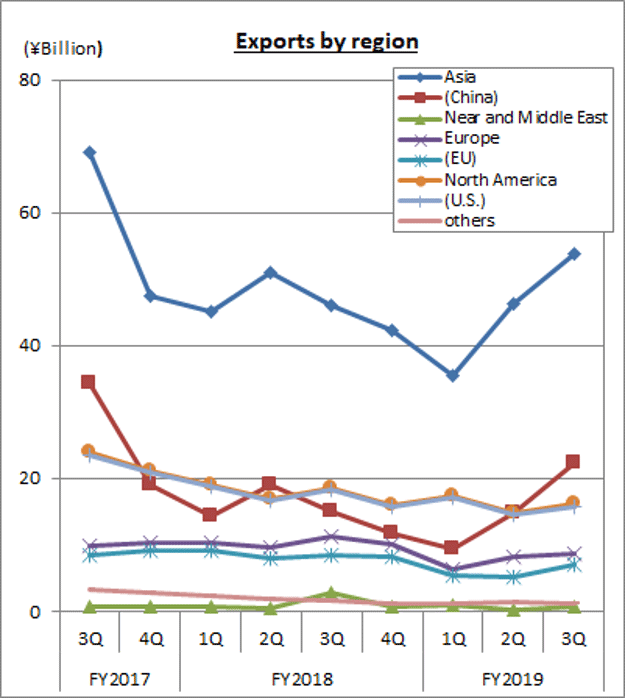
The results by region for the October-through-December period include 53.8 billion yen for Asia (up 16.7% year on year), in which exports to China totaled 22.2 billion yen (down 47.4% year on year). North America was 16.1 billion yen (-13.1% over the same period of the previous year), of which the U.S. was 15.7 billion yen (-13.9% over the same period of the previous year). Europe was 8.6 billion yen (-23.1% over the same quarter of the previous year), of which the EU was 7.1 billion yen (-16.4% over the same quarter of the previous year).
Exports of parts to emerging countries in Asia increased, and exports to Asia and China rose for the first time in 12 quarters. In addition, exports to the United States and Europe, where there is concern about the spread of the COVID-19 coronavirus accelerating again, are declining.
(3) Comparison and breakdown by region
| First: | Asia | 66.9% (+9.5% over the same period of the previous year) |
| Second: | North America | 20.0% (-3.1% over the same period of the previous year) |
| Third: | Europe | 10.7% (-3.2% over the same period of the previous year) |
| Other regions: | 2.3% (-3.2% over the same period of the previous year) |
V. Imports
(Compiled by CIAJ, based on Ministry of Finance’s “Trade Statistics”)
(1) Detailed trends by category
Actual figures by category from October to December are as follows:
Telephone sets and terminal equipment 644.8 billion yen (+18.5% over the same period of the previous year)
Of which, mobile phones were 641.7 billion yen (+18.6% over the same quarter of the previous year), cordless handsets for landline phones were 1.4 billion yen (+19.8% over the same quarter of the previous year) and other was 1.6 billion yen (+0.5% over the same quarter of the previous year). Regarding mobile phones, imports of smartphones increased, reflecting firm sales of 5G models, including new products from overseas manufacturers.
Network equipment 237.8 billion yen (+15.3% over the same period of the previous year)
This includes 32.4 billion yen for base stations (up 69.3% year on year), 198.9 billion yen for data communication equipment (up 9.3% year on year), and 6.6 billion yen for other network-related apparatuses (up 29.9% year on year). Imports of “other products (transmission equipment, communications equipment, modems, etc.)” in data communication equipment continued to increase due to growth in demand for network equipment.
- Parts (both wireline and wireless) 57.0 billion yen (+8.2% over the same period of the previous year)
(2) Detailed trends by region
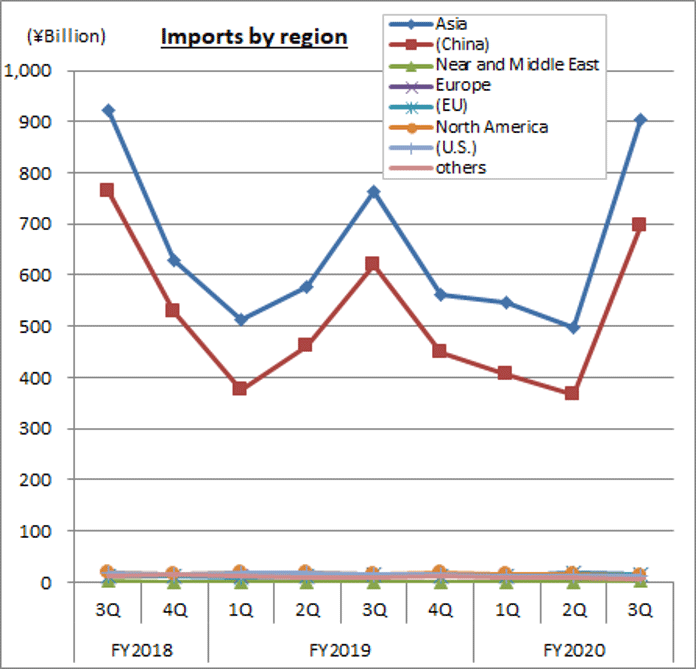
A breakdown of results for October through December by region shows that Asia was 902.6 billion yen (+18.3% over the same quarter of the previous year), of which China was 697.2 billion yen (+12.7% over the same quarter of the previous year). North America was 12.3 billion yen (-22.0% over the same quarter of the previous year), of which the U.S. accounted for 10.9 billion yen (-24.9% over the same quarter of the previous year). Europe was 16.3 billion yen (+13.3% over the same quarter of the previous year), of which the EU was 16.1 billion yen (+13.8% over the same quarter of the previous year).
(3) Comparison and breakdown by region
| First: | Asia | 96.1% (+1.1% over the same period of the previous year) |
| Second: | North America | 1.3% (-0.7% over the same period of the previous year) |
| Third: | Europe | 1.7% (-0.1% over the same period of the previous year) |
| Other regions: | 0.9% (-0.4% over the same period of the previous year) |
VI. Trends in Orders Received and Shipped
(From CIAJ statistics)
(1) Results in October through December, 2020
CIAJ statistics for total orders received and shipped in October through December amounted to 399.4 billion yen representing an increase of 10.2% year on year. This includes 317.7 billion yen for domestic shipments which rose by 11.3% year on year, and 81.7 billion yen for exports, which climbed 6.2% year on year. Orders received and shipped from April through December totaled 1,060.0 billion yen, down 4.9% year-on-year, comprising domestic shipments of 865.2 billion yen, down 2.1% year-on-year and exports of 194.8 billion yen, down 15.7% year-on-year.
*CIAJ statistics for total orders received and shipped = orders received and shipped by CIAJ member companies in Japan
(=value of shipments for the domestic market (domestic production + foreign production) + value of exports = value of domestic production + value of imports of products produced abroad)
(2) Trends by category
Actual figures by category from October to December are as follows:
Wireline terminal equipment 128.8 billion yen (-0.3% over the same period of the previous year)
Overall orders for wireline terminal equipment received and shipped were roughly on par with the previous year, reflecting an increase in demand for, primarily exports of, personal fax machines (including multifunction personal fax machines) due to the expansion of demand associated with telework due to the COVID-19 pandemic, a decrease in domestic demand for cordless handsets for landline phones and intercoms and falls in domestic demand for and exports of business fax machines (including multifunction business fax machines).
Mobile terminal equipment 117.5 billion yen (-7.5% over the same period of the previous year)
Demand for mobile phones was recovering but fell from the level of the previous year. As for other mobile terminal equipment, commercial radio terminals for government offices and exports, among other products, were firm.
Wireline network equipment 68.0 billion yen (+37.3% over the same period of the previous year)
Overall orders for wireline network equipment rose year on year, reflecting a recovery in business-related devices such as key telephones and private branch exchanges from the decline caused by the COVID-19 pandemic and the continued strong domestic demand for digital transmission equipment.
- Wireless network equipment 69.1 billion yen (+73.3% over the same period of the previous year)
Overall orders for wireless network equipment increased significantly year on year due to an increase in demand for base station communications equipment used for mobile phones ahead of the commercialization of 5G services.
- Other network equipment 9.1 billion yen (-8.3% over the same period of the previous year)
Despite an increase in demand for routers, demand for LAN switches decreased significantly due to sluggish private capital expenditures for them. As a result, orders for other network equipment as a whole decreased year on year.
- Communication equipment parts 6.9 billion yen (+3.3% over the same period of the previous year)
VII. Domestic Production, Imports and Exports for Calendar Year 2020
(1) Domestic market trends for calendar year 2020
The size of the domestic market stood at 2,817.2 billion yen for the period from January through December 2020, up 2.6% from the previous year. Demand for terminal equipment declined further due to reluctance to buy mobile phones around announcements of new rate plans in 2019 and a fall in buyers’ motivation to buy due to the COVID-19 pandemic in 2020. Meanwhile, demand for network equipment increased as capital expenditure for the construction of 5G communication infrastructure and the nationwide development of optical cable networks was not affected by the COVID-19 pandemic. As a result, the domestic market overall increased from the previous year.
(2) Domestic production for calendar year 2020
Domestic production from January to December 2020 stood at 512.7 billion yen, up 6.5% from the previous year. The year-on-year increase in domestic production was attributable to strong demand for network equipment.
(3) Exports for calendar year 2020
Exports from January through December 2020 stood at 232.8 billion yen, down 11.8% year on year. In 2019, smartphone production shrank in emerging countries in Asia due to trade friction and sluggish overseas economies, and exports of components of smartphones fell significantly. In 2020, demand overseas was weak due to the COVID-19 pandemic. As a result, exports declined from the previous year in almost all categories.
(4) Imports for calendar year 2020
Imports for January through December 2020 stood at 2,664.8 billion yen, up 0.7% from the previous year. While imports of mobile phones, which account for a large proportion of total imports, dropped from the preceding year due to stagnating domestic demand, imports of base stations and “other products (transmission equipment, communications equipment, modem, etc.)” in data communications equipment increased from the previous year, reflecting strong demand related to networks.

