The Communication and Information network Association of Japan (CIAJ) announces the telecommunication equipment production and trade figures for FY2018 (April-March) as follows.
In FY2018, the Japanese economy slowed. Real GDP growth rate for FY2018 is 0.6%, but this marks a significant slowdown from growth of 1.9% for FY2017. With the strong business conditions experienced in FY2017 continuing into FY2018, domestic demand related to private consumption and business spending grew sharply initially. Then, growth turned negative partly because of the effects of reactionary decline, unseasonable weather and natural disasters. From the second half of the fiscal year, labor-saving investment in production equipment and demand related to the Olympic and Paralympic games was firm and, with private consumption picking up largely on expectation of growth in nominal wages, domestic demand growth also remained in positive territory. However, against the backdrop of slowdown in China and other emerging economies, exports fell sharply and, with the economy already in a state where domestic demand was not a growth driver, domestic demand slumped even further due to global economic uncertainty amid the confusion caused by trade tensions between the US and China and Brexit.
Looking specifically at the telecom market, demand for terminal equipment decreased due to lengthening of the replacement cycle but demand for communication network facilities is starting to pick up on expectation of a sharp increase in data traffic due mainly to fifth-generation mobile communication systems (5G). The total value of exports decreased sharply, reflecting a major slump in parts used in the production of smartphones caused by slowdown in the world economy. The total value of imports also fell, reflecting a slump in parts due to weak domestic production and subdued production of mobile phones by Japanese manufacturers overseas and overseas manufacturers.
I. Domestic Market Trends
(1) FY2018 actual
The size of the domestic market (including the value of imports of foreign brands) was calculated from government figures, the Indices of Industrial Production and Trade Statistics of Japan, according to the following formula:
Domestic market size = value of domestic production – value of exports + value of imports
The total value of the domestic market in FY2018 (April – March) was 2,869.7 billion yen, representing negative growth of 3.3% over FY2017. This was the first negative growth for two years.
(2) Trend by categories
Actual figures by category in FY2018 (April – March) were as follows:
Terminal equipment
2,065.6 billion yen (-5.3% over FY2017)Network equipment
804.1 billion yen (+2.2% over FY2017)
II. Domestic Production
(1) FY2018 actual
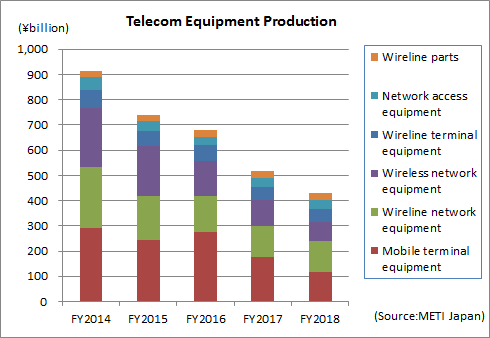
The total value of production in FY2018 (April – March) was 430.2 billion yen, representing negative growth of 16.9% over FY2017. The value of domestic production was below the year-ago level due to a slowdown in production of mobile-related terminals and base stations during a technological innovation phase and decline in production for export because of the slowdown of the world economy, offsetting an upturn in production wireline terminal equipment and wireline network equipment.
(2) Trend by categories
Actual figures by category in FY2018 (April – March) were as follows:
Wireline terminal equipment
53.6 billion yen (+0.7% over FY2017). Of which, telephone sets was 3.5 billion yen (+11.4% over FY2017) and key telephones 16.4 billion yen (-6.3% over FY2017), intercoms 32.3 billion yen (+3.6% over FY2017) and facsimiles 1.3 billion yen (unchanged). Categories that meet personal and household security needs are in an upward trend. Production of key telephones fell due to decreased exports, despite remaining flat in Japan due to a longer replacement demand cycle, which offset increased usage as an alternative to PBXs.
Mobile terminal equipment
117.9 billion yen (-33.1% over FY2017). Of which, mobile phones (including public-use PHS) was 68.2 billion yen (-37.7% over FY2017). Production of mobile phones decreased sharply. This is because the device cost has increased due to the enhancement of features and performance, leading to lengthening of the replacement cycle and also because consumers are opting to wait for the introduction of plans that completely separate the device cost from monthly charges.
Wireline network equipment
123.8 billion yen (+1.1% over FY2017). Of which, central office switching systems was 8.8 billion yen (-16.3% over FY2017), PBXs was 7.3 billion yen (+4.4% over FY2017), digital transmission equipment was 43.2 billion yen (+11.1% over FY2017) and other transmission equipment was 58.2 billion yen (-2.7% over FY2017). Production of PBXs for domestic use is trending down due to use of mobile phones for extensions use, reduction in the number of devices and the number of lines due to office downsizing, and changes in classification of PBXs and keyphones. However, exports were strong. Regarding digital transmission equipment, investment in communication network facilities such as backbone systems is increasing in anticipation of an increase in data traffic.
Wireless network equipment
73.0 billion yen (-28.3% over FY2017). Of which, fixed telecommunication devices was 33.2 billion yen (-23.0% over FY2017) and base station equipment was 39.8 billion yen (-32.3% over FY2017). Total production of wireless network equipment was below the level a year earlier mainly due to decline in base stations for mobile networks, which outweighed growth in government demand for emergency/ MCA radio base stations and private sector demand for microwave communication equipment.
Network access equipment
32.5 billion yen (-5.7% over FY2017). Total production of network access equipment was below the year-ago level due to cuts following capital spending reviews prompted by the economic slowdown, despite growth in demand due to the replacement of existing devices for cloud computing and IoT and IT investment to strengthen security.
Wireline parts (includes relay equipment for wireline systems)
29.5 billion yen (+1.0% over FY2017). Production remained mostly flat because the slowdown of the Chinese economy led to decline in overseas demand for parts used in the production of smartphones.
III. Exports
(1) FY2018 actual
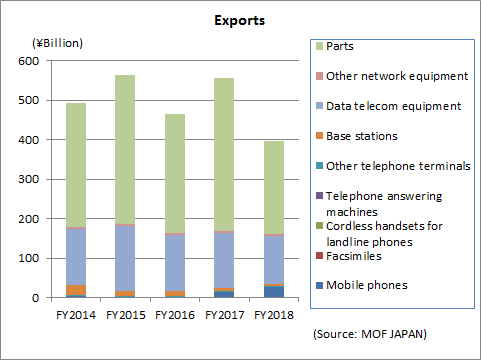
The total figure for exports in FY2018 (April – March) was 397.4 billion yen, representing significant negative growth of 28.4% over FY2017. The slowdown of the world economy led to decreased production of smartphones in China and other parts of Asia and the decreased exports of parts used in this production was a major contributing factor.
Exports of data communication equipment also showed negative year-over-year growth for the third consecutive year, reflecting decline in exports due to the slowdown of overseas economies. In telephone sets and handsets, exports of mobile phones to the U.S. continued to rise. Though small in terms of value, exports of base stations to the U.S. and EU increased and exports to Asia fell sharply.
(2) Trend by categories
Actual figures in FY2018 (April – March) by category are as follows (the facsimile category is no longer indicated from January 2018):
- Telephone sets and terminal equipment 29.8 billion yen (+67.0% over FY2017)
Of which, mobile phones was 27.1 billion yen (+80.1% over FY2017), cordless handsets for landline phones was 300 million yen (-20.7% over FY2017), and other was 2.4 billion yen (-0.9% over FY2017). - Network equipment 130.7 billion yen (-13.1% over FY2017)
Of which, base stations was 4.5 billion yen (-37.3% over FY2017), data communication equipment was 122.7 billion yen (-11.1% over FY2017) and other network equipment was 3.5 billion yen (-33.8% over FY2017). - Parts (both wireline and wireless) 237.0 billion yen (-38.7% over FY2017)
(3) Actual figures by region
A breakdown of results for FY2018 (April – March) by region shows that Asia was 261.2 billion yen (-38.5% over FY2017), of which China was 122.3 billion yen (-44.3% over FY2017). North America was 83.3 billion yen (+15.6% over FY2017), of which the U.S. was 82.2 billion yen (+15.8% over FY2017). Europe was 38.5 billion yen (-8.0% over FY2017), of which the EU was 33.6 billion yen (-8.0% over FY2017).
Exports to China decreased sharply, showing negative growth of 44.7% over FY2017 because the percentage of total parts exports accounted for by exports to China fell further to 44.3%. The value of exports of mobile phones to the U.S., which has recorded positive growth since 2017 QII, was 24.8 billion yen (+104% over FY2017).
(4) Comparison and breakdown by regions
| First: | Asia | 65.7% (-10.8% over FY2017) |
| Second: | North America | 21.0% (+8.0% over FY2017) |
| Third: | Europe | 9.7% (+2.2% over FY2017) |
| Other regions: | 3.6% (+0.6% over FY2017) |
IV. Imports
(1) FY2018 actual
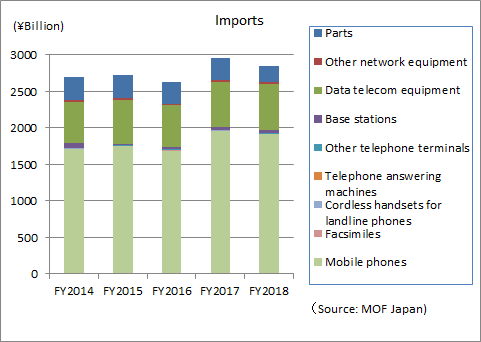
The total figure for exports in FY2018 (April – March) was 2,851.8 billion yen, representing negative growth of 3.5% over FY2017 due to decline in demand caused by weak domestic demand. In the mobile phone category, imports of smartphones fell because FY2018 was a trough year for two-year contracts and replacement demand was weak in anticipation of changes to phone plans. In the data communication equipment category, imports of other data communication equipment (transmission devices, communication devices, modems, etc.) grew 40.5% year on year in the fourth quarter and imports of communication network equipment such as backbone systems increased.
(2) Trends by categories
Actual figures by category for FY2018 (April-March) are as follows (the facsimile category is no longer indicated as of January 2018):
- Telephone sets and terminal equipment 1,923.9 billion yen (-2.2% over FY2017)
Of which, mobile phones was 1,912.0 billion yen (-2.2% over FY2017), cordless handsets for landline phones was 5.1 billion yen (-13.3% over FY2017) and other was 6.7 billion yen (+3.1% over FY2017). - Network equipment 705.5 billion yen (+4.0% over FY2017)
Of which, base stations was 41.1 billion yen (-2.3% over FY2017), data communication equipment was 639.5 billion yen (+3.9% over FY2017) and other network equipment was 24.9 billion yen (+19.3% over FY2017). - Parts (both wireline and wireless) 222.4 billion yen (-28.6% over FY2017).
(3) Actual figures by region
A breakdown of results for FY2018 (April – March) by region shows that Asia 2,686.7 billion yen (-4.4% over FY2017), of which China was 2,193.5 billion yen (-3.3% over FY2017). North America was 68.8 billion yen (-9.4% over FY2017), of which the U.S. accounted for 64.1 billion yen (-12.9% over FY2017). Europe was 54.0 billion yen (+50.3% over FY2017), of which the EU was 53.0 billion yen (+52.7% over FY2017).
In imports from Europe, base stations (+42% over FY2017), data communication equipment (+17% over FY2017) and communication network facilities increased.
(4) Comparison and breakdown by regions
| First: | Asia | 94.2% (+0.8% over FY2017) |
| Second: | North America | 2.4% (-0.7% over FY2017) |
| Third: | Europe | 1.9% (-0.1% over FY2017) |
| Other regions: | 1.5% (+0.1% over FY2017) |
V. Trends in Orders Received and Shipped
(1) FY2018 actual
CIAJ statistics for total orders received and shipped amounted to 1,577.5 billion yen, which represents negative growth of 11.7% over FY2017. Of which, the total value of domestic shipments was 1,245.2 billion yen, representing negative growth of 9.7% over FY2017, and the total value of exports was 332.3 billion yen, representing negative growth of 18.4% over FY2017.
*CIAJ statistics for total orders received and shipped = orders received and shipped by CIAJ member companies
(=value of shipments for the domestic market (domestic production + foreign production) + value of exports = value of domestic production + value of imports of products produced abroad)
(2) Trend by categories
Actual figures by category for FY2018 (April-March) were as follows:
- Wireline terminal equipment
551.8 billion yen (-8.6% over FY2017).
Cordless telephone sets and other telephone sets showed growth, reflecting firm domestic demand. Meanwhile exports of personal and office-use facsimiles (including multi-functioning devices), which are easily influenced by overseas economies, fell sharply. - Mobile terminal equipment
543.8 billion yen (-13.1% over FY2017).
Demand for mobile phones declined but demand for other mobile equipment (commercial/MCA radio terminals, etc.) doubled. - Wireline network equipment
197.5 billion yen (+1.6% over FY2017).
Exports of wireline network equipment such as digital transmission devices, modems and media converters were lackluster but domestic demand was in an upward trend, resulting in growth over FY2017. - Wireless network equipment
208.9 billion yen (-26.5% over FY2017).
In base station communication devices, government demand for emergency and MCA radio networks increased but demand for mobile phone base stations decreased because mobile communication systems are in an innovation phase. This led to negative growth over FY2017 in the category as a whole. - Other network equipment
41.2 billion yen (+9.5% over FY2017).
Demand for LAN switches for data centers, etc. remained strong and demand for other devices and wireless LAN equipment also increased, resulting in positive growth over FY2017. - Communication equipment parts
34.2 billion yen (-16.1% over FY2017).
For details, contact
Market Research
CIAJ
tel: 81-3-5403-9356 fax: 81-3-5403-9360
For more general inquiries, contact
Corporate Communications
CIAJ
tel: 81-3-5403-9351 fax: 81-3-5403-9360


