CIAJ conducted its annual study of mobile device use and announces the release of this year’s findings as follows.
The ratio of people who use a smartphone as their main device grew overall over last year, but was especially pronounced among those in their 50’s and 60’s. This led to smartphone users making up over 90% in all age groups. Low cost carriers, which include MVNOs as well as “sub-brands” operated by the major carriers continue to increase subscribers, with customer satisfaction over the pricing and other aspects quite high.
(1) Methodology
This study has been conducted as a fixed-point observation every April since 1998 to capture on-going changes in the domestic mobile communications market and include data from the busiest sales season of the year in March.
CIAJ mailed questionnaires to 1,200 mobile phones users (100 male & 100 female users in each of the following age groups: under twenty, twenties, thirties, forties, fifties, sixties) residing in the larger Tokyo and Osaka metropolitan areas from the end of March through early April of this year.
Unique findings from this year’s study are as follows.
(2) Device Trends
<Type of device owned>
- The 1,200 people surveyed owned a total of 1,750 devices and their breakdown is listed in the following table.
- 1,146 respondents (95.5%) said their main-use device (primary choice device) was a smartphone, while 47 respondents (3.9%) said it was a feature phone.
<Type of device owned by respondents of study>
Type of device owned No. of devices Main-use device
(Primary choice)Smartphone 1,171 (97.6%) 1,146 (95.5%) Featurephone 62 (5.2%) 47(3.9%) Tablet (with telecom subscription) 377 (31.4%) 1 (0.1%) Tablet (with only Wi-Fi connectivity) 73 (6.1%) 3 (0.3%) Mobile Wi-Fi router 66 (5.5%) 0 PHS 1 (0.1%) 1 (0.1%) No answer – 2 (0.2%) Total 1,750 (145.8%) 1,200 (100.0%)
<Accelerated growth of smartphone users continues>
- The 2018 survey showed continuous growth in smartphone users with a 4.9 point increase.
- The large increase of smartphone users among those in their 50’s and 60’s led to smartphone users making up over 90% in all age groups.
<Change in Percentage of Smartphone Users Over the Years>

<Tablets are dominant as second device>
- 44% of the respondents were using multiple devices, increasing from 38.7% in last year’s study.
- The rate of respondents who use tablets (with telecom subscription) was 78.7% (376 devices), tablets (with only Wi-Fi connectivity) was 14.2% (68 devices) totaling 92.9% combined.
<Users of multiple devices> Users of multiple devices
44.0%Uses of only one device
56.0%(n=1,121) <Breakdown of devices used (for respondents with second device)>

<Tablets are dominant as second device, but flat growth>
- Featurephone users decreased by 5.3 points to make up only 3.9% of respondents.
- The decrease of featurephone users among those in their 50’s and 60’s and the increase in smartphone users in the same groups were approximately the same.
(3) User Trends Among Low Cost Carrier Services
<Low cost carrier users continues to grow>
- 2.9% of respondents were using low cost carrier services, which includes MVNOs as well as “sub-brands (Y! mobile and UQ mobile)” operated by the major carriers (MNOs), which is an increase over last year’s 19.6%.
<MVNO Low Cost Smartphone Use>

<Satisfaction with low cost carriers>
- Over 98% of low cost carrier users (n=263) were satisfied voice communication charges, data transmission charges, the time to on-board and contents/ease of the agreement. Other items also received high customer satisfaction ratings.
<Satisfaction After Trying Low Cost Carriers>

(4) Purchasing Cycles
<Intention to replace devices remains within expected range>
- 65.7% of respondents indicated intention to purchase a replacement, which was 7.8 pints higher than last year. The figure has fluctuated around 70% plus or minus 10 points since 2011.
<Intent to purchase replacement of current model>

<Purchasing cycles remains relatively unchanged>
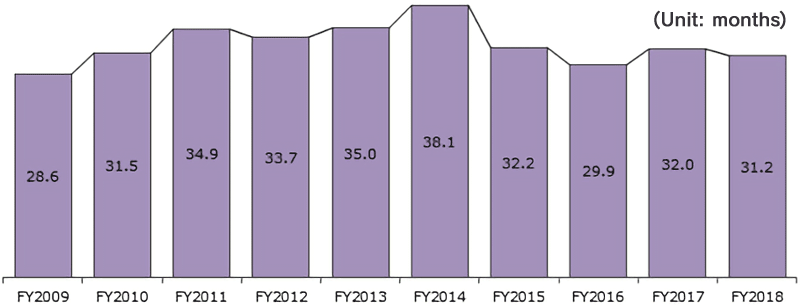
- The average use of respondents’ previous model (the one before the handset currently in use) was 31.2 months with the most popular response at 2 years.
<Change in Duration of Ownership>

(5) Decisive Factors for New Purchases
<Decisive factor in purchasing is price>
- The top ranking decisive factors in purchasing the next device were “monthly payment cost,” “purchase price of device,” “water-proof,” “manufacturer/brand,” “high-speed service,” “size (snugness in one’s hand),” “long battery life” and “mobile telecom carrier.”
(6) Use of Handset Features and Services
<Diversifying use of features and services>
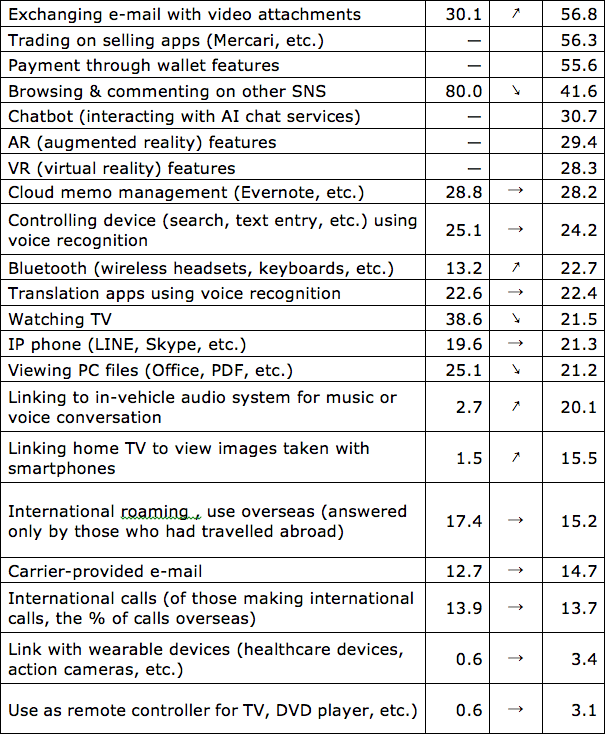
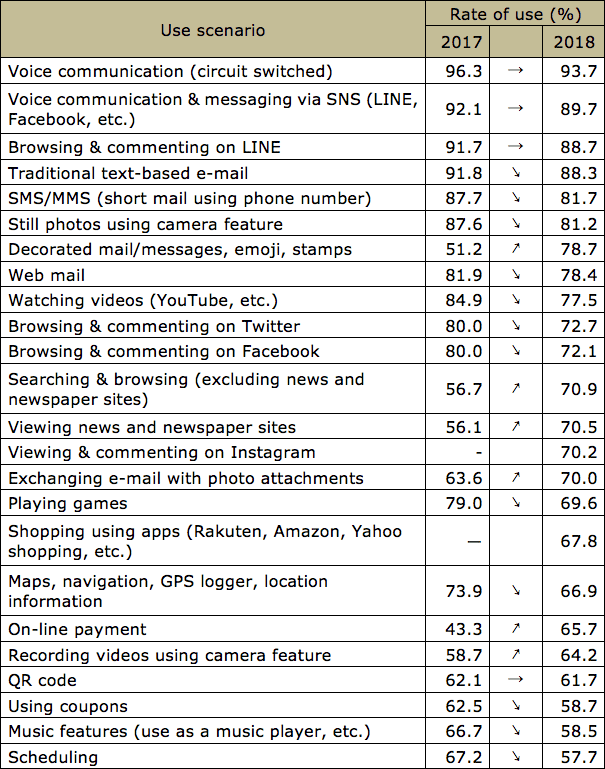
- The study has looked at the use of various features and services of mobile devices over the years. The table below indicates year-over-year change in these usage rate.
- The use of features and services are diverse and constantly evolving. This committee is continuously reviewing the list and it is our hope that manufacturers reflect these trends in future designs of their products and services.
 Arrows indicate change over the previous year, with → indicating a change of 3% or less.
– indicates an item that was not covered in the previous year’s study.
For details, contact
ICT Network & Mobile Technology Development
tel: 81-3-5403-9358 fax: 81-3-5403-9360
For more general inquiries, contact
Corporate Communications
tel: 81-3-5403-9351 fax: 81-3-5403-9360


