The Communication and Information network Association of Japan (CIAJ) announces the telecommunication equipment production and trade figures for FY2020 (April-March) as follows.
I. Summary
In FY2020, the Japanese economy recorded annual real GDP growth of minus 4.6% (first preliminary estimate released on May 18), the largest decline since the end of World War II, exceeding the decline (minus 3.6%) in FY2008 when the economy experienced the financial crisis led by the Lehman Brothers collapse. Private consumption related to the service industry declined following the declaration of a state of emergency, despite at-home consumption, and corporate capital expenditure was also sluggish partly due to a reactionary fall after picking up in the period from October through December 2020. As a result, the Japanese economy stalled. In contrast, exports were increasing following the economic recovery in the United States and China, where vaccinations were advancing.
In this environment, demand for capital expenditure continued to increase in the telecommunications equipment market in FY2020 even under the COVID-19 pandemic, in line with the construction of communications infrastructure for 5G (fifth-generation mobile communication systems) and the nationwide development of an optical cable network including the GIGA School Initiative. In addition, demand for mobile phones, which had been sluggish due to the impact of the COVID-19 pandemic, was also recovering. However, demand for business-related devices was sluggish due to the deterioration of corporate earnings and weak order activities installation work, reflecting restrictions on face-to-face sales.
(1) Domestic Market Trends
In FY2020, the total value of the domestic market (value of domestic production – value of exports + value of imports; excluding parts) stood at 3,013.9 billion yen, up 11.6% year over year. The major factor for this was an increase in imports of mobile phones, which account for the majority of the value of imports.
(2) Domestic Production Trends
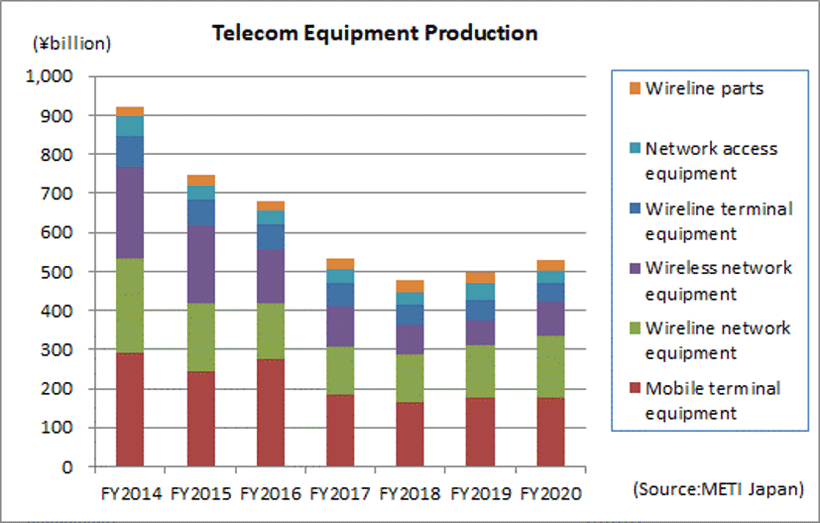
The total value of domestic production in FY2020 was 520.7 billion yen, an increase of 5.6% over FY2019. Domestic production increased from the previous year for the first time in 14 years in FY2019 and rose year on year for the second consecutive year in FY2020 due to strong demand for digital transmission equipment for the nationwide development of optical cable networks and for base station communication equipment for 5G.
(3) Export Trends
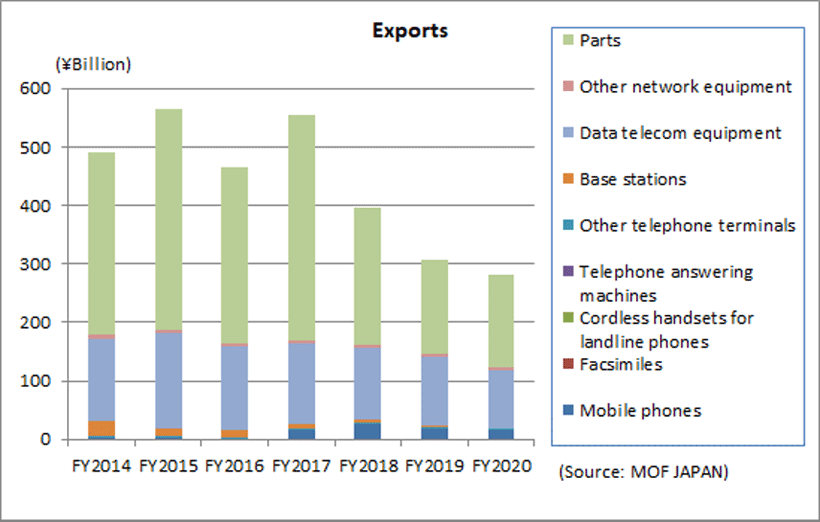
The total figure for exports in FY2020 was 280.8 billion, a decrease of 8.6% over FY2019, falling for the third consecutive year. Parts exported for smartphones produced in Asia and China account for the majority of the value of exports, and demand for these parts declined for the third consecutive year, notwithstanding a recovery for the second consecutive quarter.
(4) Import Trends
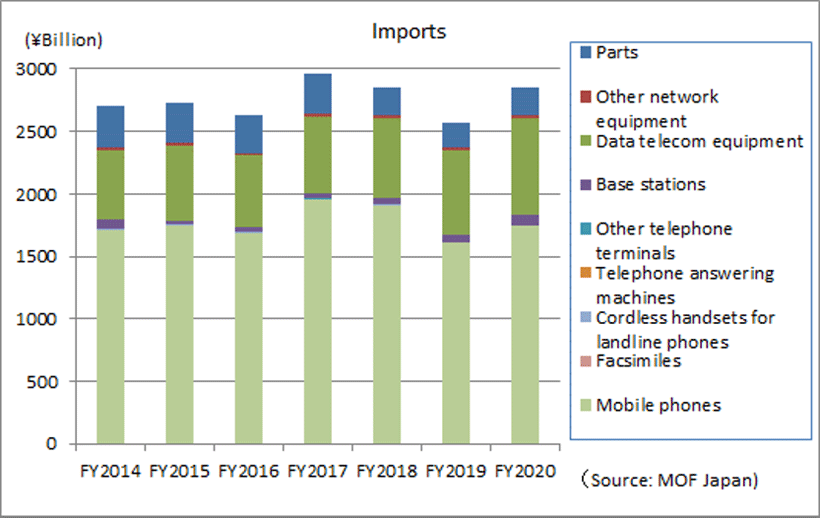
The total figure for imports in FY2020 was 2,863.7 billion yen, an increase of 11.1% over FY2019, rising for the second consecutive quarter and for the first time in three years. Imports that include smartphones produced overseas by domestic and overseas manufacturers increased because demand for smartphones was recovering. In addition to imports for the development of 5G base stations, imports of all models increased.
II. Domestic Market Trends
(Aggregated by CIAJ based on Indices of Industrial Production and Trade Statistics of Japan)
(1) Detailed trends by category
Actual figures by category for FY2020 are as follows. The size of the domestic market exceeded 3 trillion yen for the first time in six years due to the strong performance of network equipment and the growth of terminal equipment.
Terminal equipment:1,951.8 billion yen (+7.0% over FY2019)
- Network equipment:1,062.1 billion yen (+21.2% over FY2019)
The size of the domestic market (including the value of imports of foreign brands) was calculated from government figures, the Indices of Industrial Production and Trade Statistics of Japan, according to the following formula: Domestic market size = value of domestic production – value of exports + value of imports
III. Domestic Production
(Based on Indices of Industrial Production compiled by the Ministry of Economics, Trade and Industry)
(1) Detailed trends by category
Actual figures by category for FY2020 are as follows.
Wireline terminal equipment
41.8 billion yen (-14.6% over FY2019). Of this, telephone sets were 1.9 billion yen (-4.0% over FY2019), key telephones 13.5 billion yen (-4.4% over FY2019), and intercoms 26.5 billion yen (-19.6% over FY2019). Domestic production declined because demand for intercoms for homes and key telephones for office buildings was weak given restrictions on face-to-face sales and installation work from the beginning of the fiscal year as a result of the COVID-19 pandemic.
Mobile terminal equipment
175.3 billion yen (-0.4% over FY2019). Of which, mobile phones were 109.1 billion yen (+1.4% over FY2019). Mobile terminal equipment declined slightly overall as commercial radio terminals and other land telecommunication devices decreased as a backlash to special replacement demand in the previous fiscal year, despite the trend in the recovery of mobile phones produced in Japan and an increase in maritime and aeronautical mobile communications equipment.
Wireline network equipment
161.2 billion yen (+20.0% over FY2019). Of which, central office switching systems was 16.3 billion yen (+81.8% over FY2019), PBXs was 3.2 billion yen (-42.0% over FY2019), digital transmission equipment was 67.6 billion yen (+38.5% over FY2019) and other transmission equipment was 66.5 billion yen (+4.1% over FY2019). PBXs were on a downward trend affected by the reduction of audio lines by cloud services and the consolidation of corporate bases given an increasing number of people working from home. Meanwhile, in central office switching systems, demand for accommodation and conversion equipment that is necessary for the transition from public switched telephone networks to IP networks increased. Domestic production of digital transmission equipment increased for the third consecutive year on strong investment in network equipment in response to increasing data traffic.
Wireless network equipment
84.5 billion yen (+30.2% over FY2019). Of which, fixed telecommunication devices were 28.8 billion yen (-1.1% over FY0219) and base station equipment was 55.8 billion yen (+55.6% over FY2019). The domestic production of fixed communications equipment declined in both terrestrial and satellite fixed communication equipment on sluggish demand overseas, as well as fixed communication equipment for government offices, demand for which had run its course. Domestic production of base station communications equipment increased significantly for the construction of 5G communication infrastructure.
Network access equipment
32.5 billion yen (-24.4% over FY2019). Domestic production of routers for telecommunications carriers was firm due to the need to strengthen network systems for commercial 5G services, but domestic production of LAN switches decreased given the slowdown in new construction of data centers caused by COVID-19, as well as falling demand due to the extension of installation work, despite a recovery in demand owing to the GIGA School Initiative.
Wireline parts (relays and repeaters for wired equipment)
25.4 billion yen (-2.1% over FY2019). Domestic production declined year on year but showed a recovery trend quarter on quarter because parts used in the production of smartphones, which are exported to emerging countries in Asia, were recovering.
IV. Exports
(Compiled by CIAJ, based on based on Ministry of Finance’s “Trade Statistics”)
(1) Detailed trends by category
Actual figures by category for FY2020 are as follows:
Telephone sets and terminal equipment
18.6 billion yen (-15.1% over FY2019). Of this, mobile phones were 14.9 billion yen (-21.9% over FY2019), cordless handsets for landline phones were 0.25 billion yen (-5.1% over FY2019), and other was 3.5 billion yen (+35.0% over FY2019). Exports of convenience radio telecommunication devices, among other products, included in the other category to the U.S. increased, reflecting a rise in stay-at-home demand.
Network equipment
103.5 billion yen (-16.2% over FY2019). Of this, base stations were 1.2 billion yen (-53.5% over FY2019), data communication equipment was 99.5 billion yen (-15.1% over FY2019) and other network equipment was 2.8 billion yen (-24.4% over FY2019). Demand continued to decline, mainly reflecting the impact of lockdowns due to the COVID-19 pandemic.
Parts (both wireline and wireless)
158.7 billion yen (-2.0% over FY2019). Exports, while declining year on year, were recovering on a quarterly basis due to a recovery in demand for parts used in the production of smartphones
(2) Detailed trends by region
A breakdown of results for FY2020 by region shows that Asia was 178.3 billion yen (-3.4% over FY2019), of which China was 66.3 billion yen (+10.4% over FY2019). North America was 63.9 billion yen (-9.1% over FY2019), of which the U.S. was 62.7 billion yen (-9.7% over FY2019). Europe was 31.1 billion yen (-24.4% over FY2019), of which the EU was 22.6 billion yen (-33.0% over FY2019).
A breakdown of results for FY2020 by region shows that Asia was 178.3 billion yen (-3.4% over FY2019), of which China was 66.3 billion yen (+10.4% over FY2019). North America was 63.9 billion yen (-9.1% over FY2019), of which the U.S. was 62.7 billion yen (-9.7% over FY2019). Europe was 31.1 billion yen (-24.4% over FY2019), of which the EU was 22.6 billion yen (-33.0% over FY2019).
(3) Comparison and breakdown by regions
| First: | Asia | 63.5% (+3.5% over FY2019) |
| Second: | North America | 22.8% (-0.1% over FY2019) |
| Third: | Europe | 11.1% (-2.3% over FY2019) |
| Other regions | 2.7% (-1.0 % over FY2019) |
V. Imports
(Compiled by CIAJ, based on based on Ministry of Finance’s “Trade Statistics”)
(1) Detailed trends by category
Actual figures by category for FY2020 are as follows. Imports were up year on year in all categories.
Telephone sets and terminal equipment
1,753.3 billion yen (+8.1% over FY2019). Of this, mobile phones were 1,741.6 billion yen (+8.2% over FY2019), cordless handsets for landline phones were 4.7 billion yen (+4.1% over FY2019) and other was 7.0 billion yen (+1.2% over FY2019). Imports of mobile phones including those produced overseas by domestic and overseas manufacturers increased, reflecting a recovery in demand for smartphones that took place in the second half of FY2020.
Network equipment
887.4 billion yen (+17.1% over FY2019). Of this, base stations were 93.7 billion yen (+50.2% over FY2019), data communication equipment was 769.6 billion yen (+13.8% over FY2019) and other network equipment was 24.1 billion yen (+28.9% over FY2019). Of data communication equipment, switching and routing equipment was 376.6 billion yen (+1.9% over FY2019) and other data communication equipment (including transmission devices, communication devices and modems) was 393.0 billion yen (+28.0% over FY2019). Imports related to base stations and transmission devices, among other products, for the development of mobile phone infrastructure increased significantly.
Parts (both wireline and wireless)
223.0 billion yen (+11.8% over FY2019).
(2) Detailed trends by region
A breakdown of results for FY2020 by region shows that Asia was 2,709.8 billion yen (+12.3% over FY2019), of which China was 2,091.1 billion yen (+10.0% over FY2019). North America was 53.3 billion yen (-22.3% over FY2019), of which the U.S. was 47.5 billion yen (-26.7% over FY2019). Europe was 66.0 billion yen (+31.3% over FY2019), of which the EU was 63.5 billion yen (+30.3% over FY2019).
In Asia, imports of base stations and other data communication devices, as well as mobile phones, increased year on year. Europe reflected a rise in imports of base stations, other data communication devices, and parts.
(3) Comparison and breakdown by region
| First: | Asia | 94.6% (+1.0% over FY2019) |
| Second: | North America | 1.9% (-0.8% over FY2019) |
| Third: | Europe | 2.3% (+0.4% over FY2019) |
| Other regions | 1.2% (-0.6% over FY2019) |
VI. Trends in Orders Received and Shipped
(1) FY2020 actual
Total orders received and shipped by Japan-based CIAJ member companies in FY2020 amounted to 1,435.5 billion yen, down 4.4% from FY2019. Of this, the total value of domestic shipments was 1,180.9 billion yen, a decrease of 2.3% over FY2019. The total value of exports was 254.6 billion yen, a fall of 12.9% over FY2019.
Domestic shipments decreased year on year due to a decline in shipments of terminal equipment, such as mobile phones and fax machines, the values of orders and shipments for which are large, although shipments of network equipment increased.
*CIAJ statistics for orders received and shipped = orders received and shipped by Japan-based CIAJ member companies (= value of domestic shipments + value of exports = value of domestic production + value of imports for products produced overseas)
(2) Trends by category
Actual domestic shipments and exports by category for FY2020 were as follows:
Wireline terminal equipment
474.3 billion yen (-10.8% over FY2019). Demand for telephones, intercoms and office-use cordless handsets for landline phones, among other devices, remained weak due to the impact of the COVID-19 pandemic. Overall shipments of wireline terminal equipment decreased year on year as exports of mainstay business-use facsimiles (including multifunctional machines) for overseas customers declined, reflecting the promotion of teleworking amid lockdowns, coupled with a fall in domestic demand, which also applied to personal-use facsimiles (including multifunctional machines). On the other hand, exports of personal-use facsimiles (including multifunctional machines) rose, reflecting stay-at-home demand.
Mobile terminal equipment
422.5 billion yen (-6.8% over FY2019). The number of mobile phones shipped increased. However, the value of shipments decreased, reflecting a fall in unit prices due to a shift from high-end to mid-range models. Of mobile phones, however, there was an increase in both the number of smartphones shipped and the value of their shipments. In addition, shipments of other mobile terminal devices decreased, resulting in a year-on-year fall in overall shipments and exports of mobile terminal equipment.
Wireline network equipment
232.7 billion yen (+9.4% over FY2019). Domestic demand for business-use equipment such as key telephones and PBXs, while recovering partly due to the restart of capital investments, fell on a full-year basis. Exports also declined significantly. On the other hand, shipments for wireline network equipment overall increased year on year thanks to continued strength in demand for digital transmission equipment (exports declined), as well as a rise in demand for PON/MC in Japan.
Wireless network equipment
244.1 billion yen (+5.6% over FY2019). Demand for fixed terrestrial communication equipment for government offices and private sectors and fixed satellite communication equipment for government offices decreased in reaction to a significant rise that had occurred in the previous year. On the other hand, demand for base station communication equipment used for mobile phones grew steadily for the launch of 5G commercial services. As a result, overall shipments and exports of mobile network equipment rose year on year.
Other network equipment
34.7 billion yen (-22.0% over FY2019). Demand for routers for telecommunications carriers remained strong due to the strengthening of network systems for the launch of 5G commercial services. However, demand for LAN switches fell sharply due to the COVID-19 pandemic. Consequently, overall shipments and exports of other network equipment declined year on year.
Communication equipment parts
27.3 billion yen (-0.4% year on year).


