The Communications and Information network Association of Japan (CIAJ) announces the release of “The Study on Global Telecommunications Equipment Trends (unofficial translation: available in Japanese only).”
This Study continues to look at global business activities by Japanese manufacturers to capture changes in production and shipment figures. In the past, it has focused on the four categories of mobile phones, digital transmission equipment, base stations for mobile networks and backhaul equipment, but this year added routers and LAN equipment to capture the production and shipment landscape from a broader perspective.
1. Outline
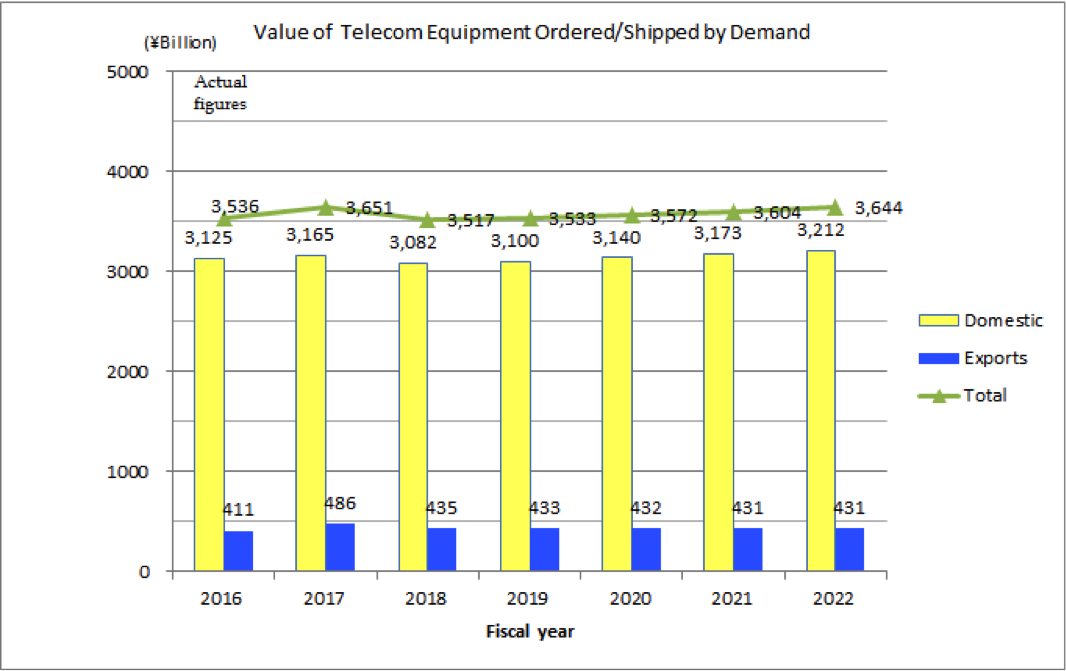
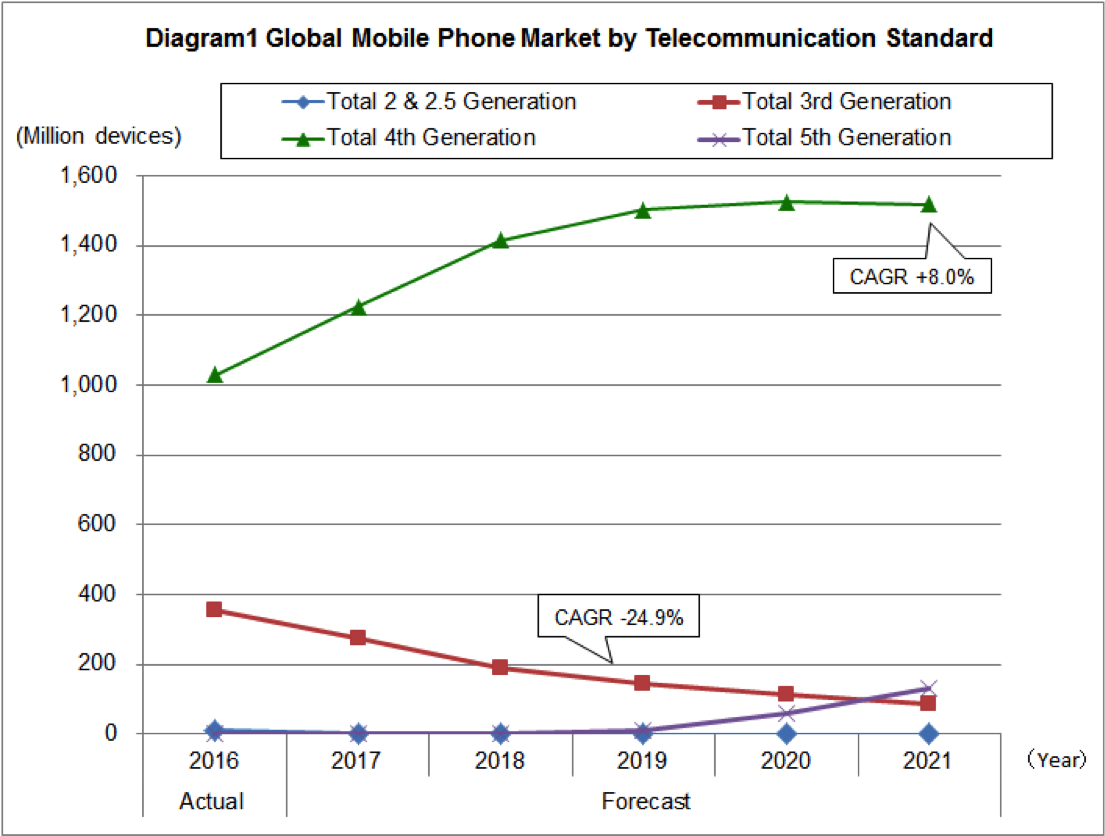
Although the growth in global demand for telecommunication equipment continues to slow down, the popularity of smartphones is still stimulating the entire industry, with its ripple effect in investments for telecommunication infrastructure equipment to keep up with rapid rise in traffic.
On the other hand, domestic production and shipment by Japanese manufacturers have continued significant declines over the years, but last year’s CIAJ study on global telecom market statistics (2012 – 2015) in the four major categories of mobile phones, base stations for mobile networks, digital transmission equipment and backhaul equipment showed the continuation in the shift to overseas production by Japanese brands and the resulting increase in shipments from their overseas sites. This year’s study indicates that this trend has not changed.
- Of the total value of production (shipments) by Japanese brands, approximately 40% was produced overseas and shipped overseas (Out-Out).
- Of the overall Japanese market, the share of shipments by foreign brands grew and exceeded 50%.
[Diagram 1: 2016 Manufactured Goods and Flow of Shipments for the Telecom Equipment Market]
In-In: Domestic production shipped domestically
In-Out: Domestic production exported overseas
Out-In: Overseas production imported into Japan
Out-Out: Overseas production shipped overseas without going through Japan
2. Changes in the flow of production and shipments by Japanese brands in the telecom equipment market
Total Production/Shipment Figures
The total production figure for Japanese brands was 2.474 trillion yen, of which 31.6% was domestic production and the remaining 68.4% was the value of products produced abroad, indicating a 7.5% drop in the value of domestic production and 8.4% drop in overseas production. Demand for mobile phones (smartphones, feature phones), which makes up a large portion of the market, decreased in 2016, in part due to the reorganization of the domestic and overseas mobile phone business by Japanese bands, including their decision to limit the number of models they produce.
The ratio of overseas production, which had been increasing over previous years, turned around and declined by 0.2% over 2015, though the proportion of products manufactured abroad still remains high. The focus on global markets and the trend to produce locally for overseas markets continues, while companies reorganize their business focus and product lineup.
By shipment destination, 49.9% was to the domestic market and the remaining 50.1% was to overseas markets. Compared to 2015, the value of shipments to the domestic market decreased by 13.3% and shipments to overseas markets decreased by 2.2%. With the drop in shipments to the domestic market, the share of domestic brands in the Japanese market also shrank over 2015 to 48.6% and foreign brands accounted for 51.4%, reversing their positions for the first time.
[Change in Production/Shipment Figures]
In-In:
Domestic production continues to decline as the Japanese market shrinks, as seen in the -4.4%change over the 2015 figure.
In-Out:
The shipment to overseas markets from production sites in Japan took a steep drop of -18.0% over 2015. The main factor was the move to local production, local consumption, but there is also an overall decrease in the recognition of Japanese brands in global markets.
Out-In:
With the shrinking of the Japanese market, shipments from overseas manufacturing sites to Japan decreased by 21%. The figure has not changed since 2013, but with the slower demand for smartphones in 2016, the out-in for both foreign brands as well as Japanese brands declined.
Out-Out:
The out-out figure continued to exceed 1 trillion yen for the second consecutive year in 2016. This was mainly due to demand growth in global markets, especially for digital transmission equipment and backhaul equipment. The newly added category to this study, network equipment (includes routers, and LAN switches), is also following the trend of local production, local consumption.
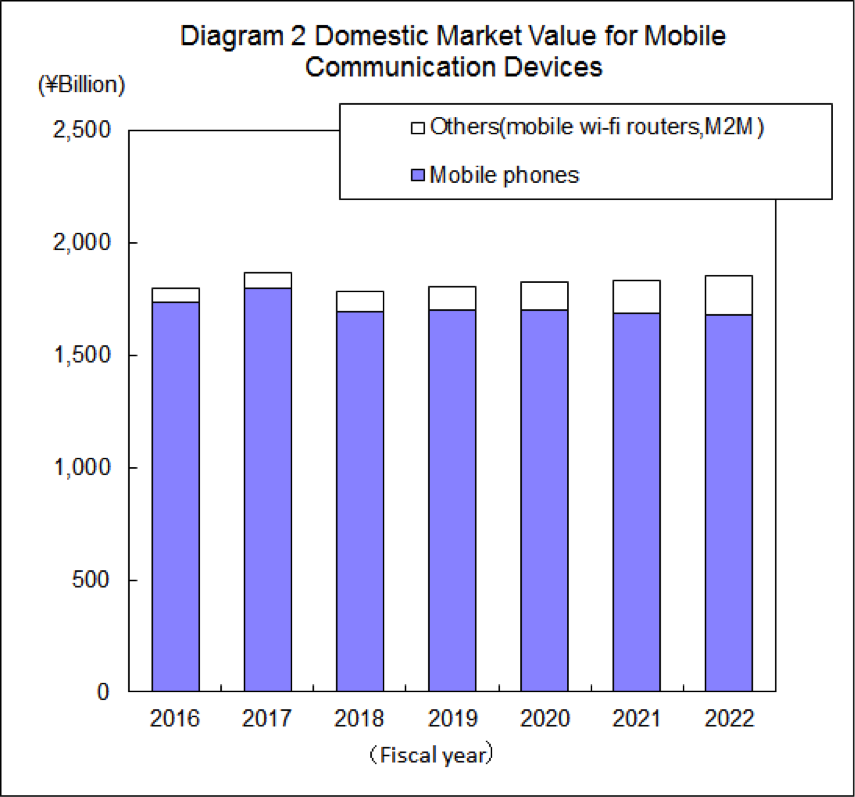
[Diagram 2: Change in Overall Telecom Market Production and Shipment Flows]
3. Summary of Production/Shipment Flows among Japanese Brands and Challenges
The following three trends were captured in this year’s study of production and shipment figures among Japanese brands, especially with the new addition of the category covering routers and LAN switches.
- Taking advantage of technological competitiveness in the categories of digital transmission equipment and backhaul equipment, Japanese brands are shipping greater amounts to overseas markets than to the domestic market, regardless of the respective market sizes in Japan. With their technological advantage, Japanese brands are not only focusing on cost competitiveness in the out-out category, but also gaining shipment volume in the domestically manufactured in-out category.
- There is increased market entry by foreign brands in the category of base stations for mobile networks, carrier-use routers, and enterprise-use LAN switches, due in part to the openness and relatively large market size in Japan. Japanese brands are not moving towards overseas manufacturing in this category due to their comprehensive support offerings (difficult to replicate overseas) and fierce price competition in global markets, making it hard for Japanese brands to penetrate. The result is joint business initiatives with foreign brands and not producing their own products (OEM, for example).
- The Japanese market for enterprise-use routers and carrier-use LAN switches is smaller compared to [2], with Japanese and foreign brands carving out a roughly equal share of the market. Japanese brands are competing by actively taking advantage of the out-in production trade to minimize costs.
While network traffic is expected to increase, advances in virtualization and software technologies (SDN/NFV) will lead to base stations, routers and LAN switches in [2] to become general purpose and converge, resulting in a gradual decline in this market’s size. Thus, especially in the carrier-use categories, increased adaptation to virtual networks through joint ventures with foreign brands (multi-vendor) can be expected.
On the other hand, in [1], new business and consumer-facing physical hardware (transmission and conversion) that cannot be virtualized or switched to software-centric systems will be installed with 5th generation technologies in scope. There is optimism for new product development among high-speed compatible mobile network equipment for the last one mile for homes and offices, as well as IoT transmission equipment to enlarge the IoT monitored areas at factories and other venues that will lead to greater market size.
[Diagram 3: Production and Shipment Flows by Category]
4. Other
Lower demand in 2016 resulted in decreased shipments, for both domestic as well as overseas markets, in numerous categories, but it is evident that Japanese brands are still relying on the out-out (overseas production-shipment overseas) business model to grow their business.
This year’s study covered 8 items in 6 categories to capture three patterns of production and shipments. For example, digital transmission equipment and backhaul equipment are making their mark by using their technological advantage not only in the out-out category but also in the in-out category. In base stations for mobile networks, carrier-use routers, enterprise-use LAN switches, where rapid virtualization is becoming prevalent, Japanese brands are being impacted by foreign brands in not only the Japanese market, but overseas market as well. Enterprise-use router and carrier-use LAN switch market is currently split even with foreign brands, where Japanese brands are aggressively relying on out-in to compete.
Last year, CIAJ made clear the intent to make policy proposals in how statistics are tallied (more granular categorization of equipment type in production figures and trade figures to provide more accurate insights). To that extent, working together with the Ministry of Economy, Trade and Industry (METI), CIAJ submitted a request to the Ministry of Finance to make the equipment category used in their statistics more granular. This effort resulted in the use of “switching equipment and routing equipment” and “other (such as digital transmission equipment, modems, PON/media converters)” instead of “voice, image and other data reception, conversion, transmission and playback equipment (data telecommunication equipment).” This means that in the future, more details can be gained from import statistics (performance of foreign brands) to identify evolving market trends, such as virtualization and switch to software centric systems in “switching equipment and routing equipment.”
CIAJ will continue to support business activities, including global initiatives, of Japanese brands through our statistical efforts, pursuing better ways of understanding new global market developments and more accurately grasping market trends, such as 5G and IoT.
For details, contact
Market Research
CIAJ
tel: 81-3-5403-9356 fax: 81-3-5403-9360
For more general inquiries, contact
Corporate Communications
CIAJ
tel: 81-3-5403-9351 fax: 81-3-5403-9360