The Communication and Information network Association of Japan (CIAJ) announces the telecommunication equipment and trade figures for April through June, 2018 as follows.
Japan’s GDP during April through June 2018 grew YoY (year-over-year) at an annual rate of 1.9% according to the preliminary figures announced this month by the Cabinet Office. It was a return to positive growth after a decline last quarter. Underlying factors include higher consumer spending and robust capital investments compared to the January – March quarter. A gradual recovery is expected to continue as business and global economies continue to show a steady growth to encourage capital spending and healthy exports despite risks from the trade friction between the United States and China.
In the telecom equipment market, replacement demand for handsets and capital investments in cellular infrastructure is slowing. On the other hand, exports of key telephones, PBXs and digital transmission equipment reflected the healthy economic recovery abroad. The shift to overseas production continues, pushing down YoY domestic production, but the domestic market size has grown to exceed 2016 Q1.
I. Domestic Market Trends (new category)
(Aggregated by CIAJ based on Indices of Industrial Production and Trade Statistics of Japan)
(1) FY2018 1st quarter actual
The size of the domestic market (including the value of imports of foreign brands) was calculated from government figures, the Indices of Industrial Production and Trade Statistics of Japan, according to the following formula:
Domestic market size = value of domestic production – value of exports + value of imports
The total value of the domestic market was 535.4 billion yen, or negative 9.2% growth over the same quarter in FY2017. However, the figure is 1.7% above the 2016 Q1 figure, indicating signs of an overall recovery.
(2) Trend by categories
Actual figures by category for April through June were as follows:
Terminal equipment
368.8 billion yen (-6.5% over the same quarter of the previous year).Network equipment
166.6 billion yen (-14.8% over the same quarter of the previous year).
Table 1: Domestic Market (by categories/quarter)

(Note) Five-year Market Size Trends (Table 1-2)
The actual domestic market size from FY2013 through FY2017 was as follows. The figure in 2017 returned to positive growth for the first time in four years.
Table 2: Domestic Market (by categories/fiscal year)

II. Domestic Production
(Based on Indices of Industrial Production compiled by the Ministry of Exonomics, Trade and Industry)
(1) FY2018 1st quarter actual
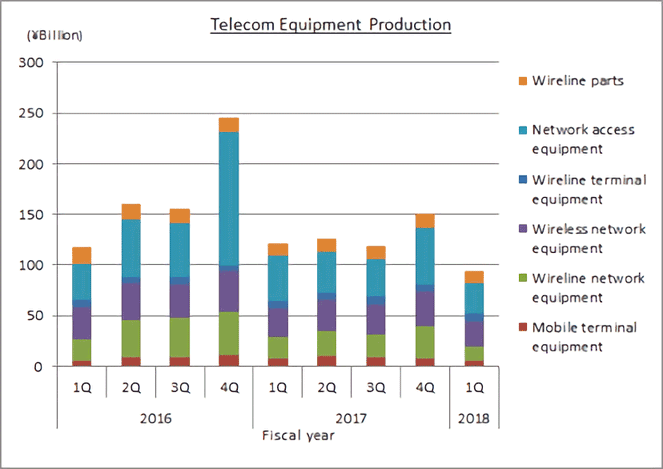
The total value of production was 93.7 billion yen, or negative 22.6% growth over the same quarter in FY2017. With the recovery of economies abroad, production targeting exports did well, such as key telephones, PBXs, digital transmission equipment and parts for new smartphone models produced overseas. However, production for the domestic market, especially mobile phones and mobile infrastructure equipment continued to show negative growth, as the industry faces a technological transition period, pushing the entire production figure lower.
(2) Trend by categories
Actual figures by category for April through June were as follows:
Wireline terminal equipment
11.4 billion yen (-5.8% over the same quarter of the previous year). Of which telephone sets was 700 million yen (-6.6% over the same quarter of the previous year) and key telephones 3.5 billion yen (-1.3% over the same quarter of the previous year), intercoms 6.9 billion yen (-8.5% over the same quarter of the previous year) and facsimiles 300 million yen (+12.1% over the same quarter of the previous year). The high demand for exports kept the figure for key telephones at basically same YoY levels.
Mobile terminal equipment
30.0 billion yen (-31.6% over the same quarter of the previous year). Of which mobile phones was 21.4 billion yen (-39.4% over the same quarter of the previous year) and public-use PHS 200 million yen (-41.9% over the same quarter of the previous year). Demand for mobile phones was low, as the period was in between the 2-year contract renewal cycle, as well as aggressive campaigns by foreign brands.
Wireline network equipment
25.4 billion yen (-10.7% over the same quarter of the previous year). Of which central office switching systems was 1.9 billion yen (-14.2% over the same quarter of the previous year), central office switching systems was 1.2 billion yen (+5.4% over the same quarter of the previous year) and digital transmission equipment was 8.2 billion yen (-16.2% over the same quarter of the previous year) and other transmission equipment was 12.9 billion yen (-8.6% over the same quarter of the previous year). Although export demand for central office switching systems grew and new demand from domestic office building and hotel construction is expected, the drop in unit price is expected to contribute to overall gradual decline.
Wireless network equipment
13.9 billion yen (-35.6% over the same quarter of the previous year). Of which fixed telecommunication devices was 5.2 billion yen (-6.5% over the same quarter of the previous year) and base station equipment was 8.7 billion yen (-45.8% over the same quarter of the previous year). Production of fixed communication devices for both terrestrial and satellite systems, as well as base station equipment for non-government use took a sharp decline.
Network access equipment
5.4 billion yen (-31.9% over the same quarter of the previous year). Demand for network equipment was strong with the growth in network traffic, but fierce competition with foreign brands resulted in negative domestic production.
Wireline parts (includes relay equipment for wireline systems)
7.6 billion yen (+6.6% over the same quarter of the previous year). Increased overseas production of new smart phone models by U.S. and other brands resulted in a higher figure.
III. Exports
(Compiled by CIAJ, based on based on Ministry of Finance’s “Trade Statistics”)
(1) FY2018 1st quarter actual
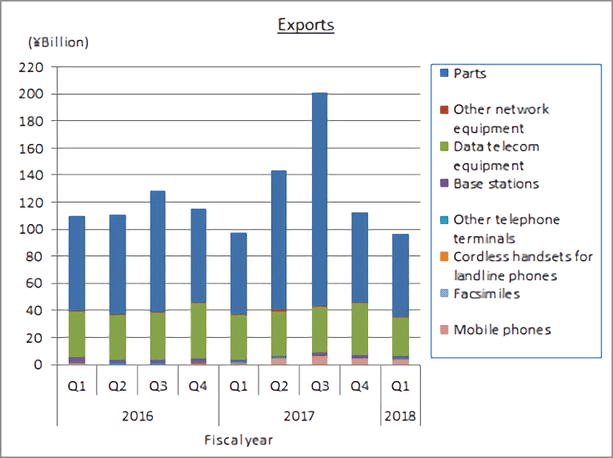
The total figure for exports for April through June was 96.2 billion yen. The figure remained basically unchanged at -1.5%, with the growth in production of parts targeting exports for new smartphone models produced in other Asian countries from Q1 balanced out by the decrease in data communication equipment.
In data communication equipment, demand for wireline network equipment, such as central office switching systems and digital transmission equipment grew, but was not enough to out-balance the decline in wireless network equipment, as the market entered a transition period to newer technology. All together, the export of digital communication equipment to almost all regions showed negative growth and fell below 30 billion yen for the first time in 22 quarters.
In telephone and handsets, exports of mobile phones to the U.S. has recorded positive YoY growth since 2017 Q2. The positive growth of exports of base stations to the U.S. and the EU was out-weighed by the significant drop to Asia.
(2) Trend by categories
Actual figures from April through June by category are as follows (the facsimile category is no longer applied from January 2018):
- Telephone sets and terminal equipment 4.6 billion yen (+202.9% over the same quarter of the previous year)
Of which, mobile phones was 3.8 billion yen (+404.7% over the same quarter of the previous year), cordless handsets for landline phones was 130 million yen (+39.9% over the same quarter of the previous year), and other was 700 million yen (+5.1% over the same quarter of the previous year). - Network equipment 30.6 billion yen (-15.3% over the same quarter of the previous year)
Of which, base stations was 1.3 billion yen (-35.8% over the same quarter of the previous year), data communication equipment was 28.4 billion yen (-12.8% over the same quarter of the previous year) and other network equipment was 800 million yen (-43.3% over the same quarter of the previous year). - Parts (both wireline and wireless) 61.0 billion yen (+1.6% over the same quarter of the previous year)
(3) Actual figures by region
By region, Asia was 65.9 billion yen (-4.4% over the same quarter of the previous year), of which China was 30.4 billion yen (-5.4% over the same quarter of the previous year). North America was 17.2 billion yen (+12.5% over the same quarter of the previous year), of which the U.S. was 16.9 billion yen (+12.8% over the same quarter of the previous year). Europe was 9.6 billion yen (-2.4% over the same quarter of the previous year), of which the EU was 8.5 billion yen (-3.6% over the same quarter of the previous year).
The export of parts to China decreased to 43.0% of total exports. The smartphone dissemination rate in China reached 100% in 2017 and production decreased with lower replacement demand. However, the shift in production to other Asian countries continues. The export of mobile phones to the U.S. was 3.4 billion yen (+5,529% over the same quarter of the previous year) and recorded the fourth consecutive positive growth since 2017 Q2.
(4) Comparison and breakdown by regions
| First: | Asia | 68.6% (-7.9% over the same quarter of the previous year) |
| Second: | North America | 17.9% (+4.9% over the same quarter of the previous year) |
| Third: | Europe | 10.0% (+2.5% over the same quarter of the previous year) |
| Other regions: | 3.6% (+0.6% over the same quarter of the previous year) |
IV. Imports
(Compiled by CIAJ, based on based on Ministry of Finance’s “Trade Statistics”)
(1) FY2018 1st quarter actual
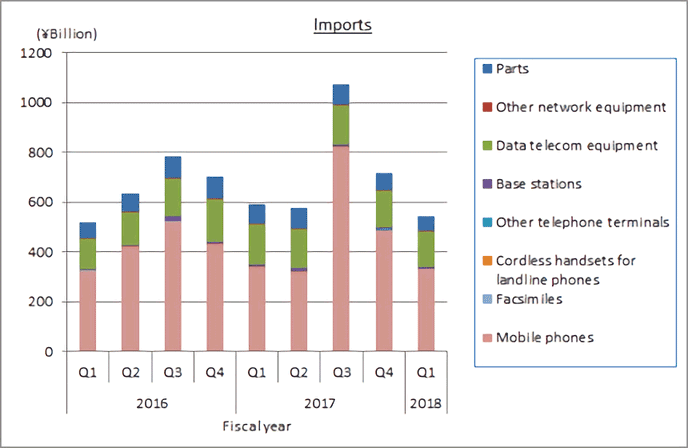
The total figure for exports from April through June was 542.4 billion yen (-8.1% over the same quarter of the previous year). Domestic demand for mobile phones was low, as the period was in between the 2-year contract renewal cycle and resulted in a negative YoY growth. Network equipment also decreased as the market entered a transition period to newer technology.
(2) Trend by categories
Actual figures by category are as follows (the facsimile category is no longer applied from January 2018):
- Telephone sets and terminal equipment 332.0 billion yen (-1.9% over the same quarter of the previous year)
Of which, mobile phones was 329.0 billion yen (-1.9% over the same quarter of the previous year), cordless handsets for landline phones was 1.6 billion yen (+14.0% over the same quarter of the previous year) and other was 1.4 billion yen (-15.7% over the same quarter of the previous year). - Network equipment 152.6 billion yen (-12.2% over the same quarter of the previous year)
Of which, base stations was 7.7 billion yen (-12.8% over the same quarter of the previous year), data communication equipment was 139.5 billion yen (-12.7% over the same quarter of the previous year) and other network equipment was 5.4 billion yen (+5.8% over the same quarter of the previous year). - Parts (both wireline and wireless) 57.9 billion yen (-26.1% over the same quarter of the previous year).
(3) Actual figures by region
By region, Asia was 505.2 billion yen (-9.0% over the same quarter of the previous year), of which China was 373.9 billion yen (-9.8% over the same quarter of the previous year). North America was 15.9 billion yen (-12.0% over the same quarter of the previous year), of which the U.S. accounted for 15.0 billion yen (-15.3% over the same quarter of the previous year). Europe was 14.3 billion yen (+67.9% over the same quarter of the previous year), of which the EU was 14.0 billion yen (+71.7% over the same quarter of the previous year).
The import of most categories from Europe grew substantially, specifically mobile telephones (+1,290.0% over the same quarter of the previous year), base stations (+336% over the same quarter of the previous year), data communication equipment (+23% over the same quarter of the previous year) and parts (+281% over the same quarter of the previous year).
(4) Comparison and breakdown by regions
| First: | Asia | 93.1% (-0.3% over the same quarter of the previous year) |
| Second: | North America | 3.1% (-0.2% over the same quarter of the previous yearear) |
| Third: | Europe | 2.0% (+0.6% over the same quarter of the previous year) |
| Other regions: | 1.4% (-0.1% over the same quarter of the previous year) |
V. Trends in Orders Received and Shipped
(from CIAJ statistics)
(1) FY2018 1st quarter actual
CIAJ statistics for total orders received and shipped amounted to 356.0 billion yen (-14.2% over the same quarter of the previous year) for the quarter. Of which the total value of domestic shipments totaled 270.9 billion yen (-16.5% over the same quarter of the previous year) and exports was 85.0 billion yen (-5.7% over the same quarter of the previous year).
CIAJ statistics for total orders received and shipped = orders received and shipped by CIAJ member companies
(total orders received and shipped = value of shipments for the domestic market (domestic production + foreign production) = value of domestic production + value of imports of products produced abroad)
(2) Trend by categories
Actual figures by categories for April through June were as follows:
- Wireline terminal equipment
132.5 billion yen (-2.6% over the same quarter of the previous year).
Cordless handsets, other telephone terminals, office-use cordless handsets and intercoms did well, but the drop in domestic demand as well as exports of personal and office-use facsimiles (including multi-functioning devices) pushed the overall figure down. - Mobile terminal equipment
128.6 billion yen (-20.4% over the same quarter of the previous year).
Low domestic demand due to brands refraining from launching new summer models as it was the period in the middle of the 2-year mobile contract coverage resulted in negative growth for the category. - Wireline network equipment
40.1 billion yen (-17.7% over the same quarter of the previous year).
Other transmission equipment category had healthy growth, but was not enough to make up for drops in other categories. - Wireless network equipment
36.2 billion yen (-26.6% over the same quarter of the previous year).
Demand for base stations from the public sector was positive, but domestic as well as export demand for the category as a whole was low, as the market entered a transition period to newer technology. - Other network equipment
9.0 billion yen (+12.2% over the same quarter of the previous year).
Positive growth resulted from healthy demand for LAN switches and other categories. - Communication equipment parts
9.6 billion yen (-15.5% over the same quarter of the previous year).
For details, contact
Market Research
CIAJ
tel: 81-3-5403-9356 fax: 81-3-5403-9360
For more general inquiries, contact
Corporate Communications
CIAJ
tel: 81-3-5403-9351 fax: 81-3-5403-9360


