The Communication and Information network Association of Japan (CIAJ) announces the telecommunication equipment and trade figures for FY2017 April through March) as follows.
Japan’s real GDP during January through March 2018 grew YoY (year-over-year) at an annual rate of -0.6%, the first negative growth in nine quarters, according to the preliminary figures announced by the Cabinet Office on May 16th. Compared to the October – December quarter, domestic consumer spending, capital investments by the private sector and housing investments had a negative influence on the figure, but continued positive demand in overseas markets led to the real GDP for FY2017 to record positive 1.5% for the fiscal year. This reflects the overall economic climate of gradual recovery supported by global economies and corporate performance.
The domestic telecommunication equipment market for FY2017 experienced healthy demand for smartphone upgrades, but infrastrucure equipment demand shrank, as carriers held back on capital investments. On the otherhand, in exports, multi-functioning facsimiles did well with economic recovery overseas. Domestic production of telecommunication equipment decreased again as relocation of manufacturing facilities overseas continued. Exports grew YoY as demand for parts remained healthy in conjunction with increased global production of smartphones. Demand for smartphones also played a significant role in imports, as both domestic as well as foreign brands experienced healthy growth as did other categories to result in positive YoY growth.
I. Domestic Production
(Based on Indices of Industrial Production compiled by the Ministry of Exonomics, Trade and Industry)
(1) FY2017 actual (April – March)
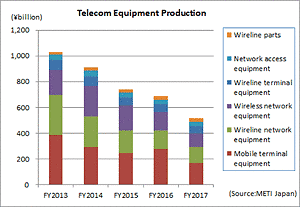
The total value of production in FY2017 was 518.2 billion yen, or negative 24.4% growth over FY2016. The large drop was a combined result of continued relocation of manufacturing facilities abroad as well as a slowdown in capital investments for business equipment and infrastructure equipment (wireline as well as radio) by enterprises and carriers.
(2) Trend by categories
Actual figures by categories were as follows:
Wireline terminal equipment : 57.7 billion yen (-8.3% over FY2016). Of which telephone sets was 3.1 billion yen (-5.1% over FY2016), key telephones was 22.2 billion yen (-13.5% over FY2016), intercoms 31.2 billion yen (-13.5% over FY2016) and facsimiles 1.2 billion yen (-11.0% over FY2016).
Mobile terminal equipment : 171.0 billion yen (-39.0% over FY2016). Of which mobile phones was 103.0 billion yen (-30.3% over FY2016) and public-use PHS 1.4 billion yen (+20.4% over FY2016). Despite the healthy demand for smartphone upgrades, domestic production of mobile phones continues to drop. On the other hand, imports of mobile phones from overseas grew to 1.971 trillion yen (+15.8% over FY2016).
Wireline network equipment : 122.9 billion yen (-13.5% over FY2016). Of which switching systems was 6.2 billion yen (-29.2% over FY2016), central office switching systems was 11.9 billion yen (-25.2% over FY2016) and digital transmission equipment 38.9 billion yen (-16.0% over FY2016) and other transmission equipment was 59.8 billion yen (-4.0% over FY2016). Enterprise equipment and network equipment recorded negative growth, impacted by the supply of large to mid-sized office buildings being pushed back to FY2018. New demand is expected for key telephones, central office switching systems, facsimiles and other related equipment over the next 3 years, but the simultaneous drop in unit prices is expected to gradually push figures downwards for the overall category.
Wireless network equipment : 101.8 billion yen (-26.7% over FY2016). Of which fixed telecommunication devices was 43.1 billion yen (+2.3% over FY2016) and base station equipment was 58.7 billion yen (-39.4% over FY2016). Demand for terrestrial microwave communication equipment among emerging markets abroad and successful satellite launches in Japan (including quasi-zenith satellites) contributed to positive growth for fixed telecommunication devices. The end to the most recent cycle of capital investments to accommodate faster communication speeds led to the dramatic drop in base stations.
Network access equipment : 36.3 billion yen (+5.9% over FY2016). The completion of capital investments in LTE base stations for mobile networks has resulted in flat growth since FY2015.
Wireline parts : 28.4 billion yen (+7.1% over FY2016). Robust demand in parts for major domestic, U.S. and Korean smart phone production recorded positive YoY growth.
II. Exports
(Compiled by CIAJ, based on based on Ministry of Finance’s “Trade Statistics”)
(1) FY2017 actual (April – March)
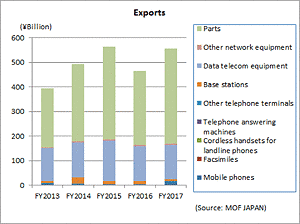
The total figure for exports in FY2017 (April through March) was 555.1 billion yen. The plateauing of smartphone demand in Asia in the 4th quarter translated into slower export growth, especially among smartphone parts, but the healthy domestic and overseas demand for smartphones earlier in the year was enough to lead to a 19.6% increase in exports. The export of mobile phones and terminal equipment for the U.S. market is indicating growth from FY2017. The end to the cycle in investments for LTE throughout global markets led to a significant drop in base stations in the network equipment category. In data equipment, figures declined in emerging Asian markets with the exception of China, but demand was basically flat. Robust demand in parts for major domestic, U.S. and Korean smart phone production recorded large YoY growth.
(2) Trend by categories
Actual figures by category are as follows (collection of statistics for facsimiles was terminated from January, 2018 and only include Q1 through Q3 figures):
Telephone sets and terminal equipment 17.9 billion yen (+323.1% over FY2016)
Of which, mobile phones was 15.0 billion yen (+886.2% over FY2016), facsimiles was 0.1 billion yen (―%), cordless handsets for landline phones was 0.4 billion yen (+53.9% over FY2016) and other was 2.4 billion yen (+5.3% over FY2016).
Network equipment 150.4 billion yen (-5.3% over FY2016)
Of which, base stations was 7.2 billion yen (-42.1% over FY2016), data communication equipment was 138.0 billion yen (-2.5% over FY2016) and other network equipment was 5.2 billion yen (+3.9% over FY2016).
- Parts (both wireline and wireless) 386.8 billion yen (28.4% over FY2016)
(3) Actual figures by region
By region, Asia was 424.5 billion yen (+22.3% over FY2016), of which China was 219.6 billion yen (+8.7% over FY2016). North America was 72.1 billion yen (+11.3% over FY2016), of which the U.S. accounted for 71.0 billion yen (+11.8% over FY2016). Europe was 41.8 billion yen (+11.6% over FY2016), of which the EU was 36.6 billion yen (+8.5% over FY2016). Exports of parts to China, which accounted for 70.5% of all exports in FY2015 and 60.3% in FY2016, dropped to 50.4% in FY2017. The production of smartphones in China has hit a ceiling and is decreasing, while production in other Asian countries continues to grow. Mobile phones to the U.S. market recorded explosive growth throughout the year, totaling 12.2 billion yen (+10,156.8% over FY2016)
(4) Comparison and breakdown by regions
| First: | Asia 76.5% (+1.8% over FY2016) |
| Second: | North America 13.0% (-0.9% over FY2016) |
| Third: | Europe 7.5% (-0.6% over FY2016) |
| Other regions: | 3.0% (-0.3% over FY2016) |
III. Imports
(Compiled by CIAJ, based on based on Ministry of Finance’s “Trade Statistics”)
(1) FY2017 actual (April – March)
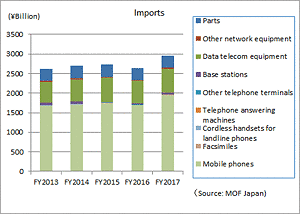
The total figure for exports in FY2017 (April through March) was 2.958 trillion yen, recording 12.5% YoY growth, helped by healthy domestic demand for smartphones. Positive growth in mobile phones reflected an increase in shipments of new smartphones from China to the U.S. in Q3 as well as upgrade demand before the new year. Domestic demand for LTE has tapered off, but there was positive growth in base stations and data transmission equipment. New subcategories (switching & routing equipment, other) under data transmission equipment in imports should allow more detailed understanding of switching & routing equipment market trends, such as growing emphasis in virtualization and software.
(2) Trend by categories
Actual figures by category are as follows (collection of statistics for facsimiles was terminated from January, 2018 and only include Q1 through Q3 figures):
Telephone sets and terminal equipment 1.971 billion yen (+15.6% over FY2016)
Of which, mobile phones was 1.954 trillion yen (+15.8% over FY2016), facsimiles was 3.9 billion yen (―% over FY2016), cordless handsets for landline phones was 5.9 billion yen (+14.2% over FY2016) and other was 6.5 billion yen (-6.6% over FY2016).
Network equipment 676.1 billion yen (+8.5% over FY2016)
Of which, base stations was 42.1 billion yen (+23.9% over FY2016), data communication equipment was 613.2 billion yen (+7.3% over FY2016) and other network equipment was 20.8 billion yen (+16.8% over FY2016).
- Parts (both wireline and wireless) 311.5 billion yen (+2.4% over FY2016)
(3) Actual figures by region
By region, Asia was 2.812 trillion yen (+13.3% over FY2016), of which China was 2.671 trillion yen (+6.7% over FY2016). North America was 75.9 billion yen (+4.4% over FY2016), of which the U.S. accounted for 73.7 billion yen (+5.7% over FY2016). Europe was 35.9 billion yen (+0.6% over FY2016), of which the EU was 34.7 billion yen (+0.6% over FY2016).
(4) Comparison and breakdown by regions
| First: | Asia 93.4% (-0.8% over FY2016) |
| Second: | North America 3.1% (+0.3% over FY2016) |
| Third: | Europe 2.0% (+0.6% over FY2016) |
| Other regions: | 1.4% (-0.2% over FY2016) |
IV. Trends in Orders Received and Shipped
(from CIAJ statistics)
(1) FY2017 actual (April – March)
CIAJ statistics for total orders received and shipped amounted to 1.774 trillion yen (-3.0% over FY2016). The total value of domestic shipments totaled 1.367 trillion yen (-6.2% over FY2016) and exports was 407.4 billion yen (+9.7% over FY2016).
Orders received and shipped tallied by CIAJ =
Orders received and shipped by CIAJ domestic manufacturing members (value of domestic production + value of overseas production imported to Japan)
(2) Trend by categories
Actual figures by categories were as follows:
Wireline terminal equipment : 648.3 billion yen (+2.6% over FY2016).
Healthy performance of intercoms, office-use facsimiles for the domestic market and multi-functioning personal facsimiles for overseas markets helped push the category into positive growth.
Mobile terminal equipment : 625.6 billion yen (+4.8% over FY2016).
New product line-ups and upgrade demand pushed the entire category into positive growth.
Wireline network equipment : 137.5 billion yen (-18.7% over FY2016).
WDM transmission equipment and modems showed positive YoY growth, but the category as a whole recorded negative performance, as carriers decreased capital investments.
Wireless network equipment : 284.2 billion yen (-18.8% over FY2016).
Terrestrial communication equipment to the public sector as well as exports showed positive growth, as did demand from successful satellite launches in Jaspan. However, the completion of capital investments in LTE base stations for mobile networks resulted in a significant drop, pushing the category as a whole into negative growth.
Other network equipment : 37.7 billion yen (-5.6% over FY2016).
Both routers and LAN switches showed negative growth as demand for the public sector and carriers shrank.
Parts : 40.8 billion yen (-0.5% over FY2016).
For details, contact
Market Research
CIAJ
tel: 81-3-5403-9356 fax: 81-3-5403-9360
For more general inquiries, contact
Corporate Communications
CIAJ
tel: 81-3-5403-9351 fax: 81-3-5403-9360


