The Communications and Information network Association of Japan (CIAJ: a general incorporated association) announces the telecommunication equipment production and trade figures for April through September, 2017 as follows.
The Cabinet Office of Japan announced a +2.5% real GDP (annual) growth for July – September (2nd update), making a positive 1.4% adjustment from its initial announcement. Unchanged from the earlier announcement was consumer spending at -0.5% and export growth at 1.5%, continuing to support the export-driven view of the economy.
The domestic telecommunication equipment market showed positive growth towards the end of FY2016, but reversed gear in the first half of FY2017 (year-over-year growth). Exports returned to positive growth from FY2017 Q2, the first time since the latter half of FY2015, or the first in seven quarters, fueled by parts demand for a major US smart phone manufacturer. Despite the uptake in domestic demand, imports remained basically flat.
I. Production Trends
(based on METI’s “Indices of Industrial Production”)
(1) Actual figures for first half of FY2017
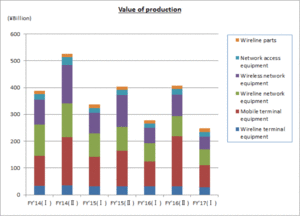
The total value of domestic production in the first half of FY2016 was 248.7 billion yen (-10.6% year-over-year growth). Weakness in mobile phones, switching systems, digital transmission equipment and base stations contributed to the negative growth.
(2) Figures by equipment categories
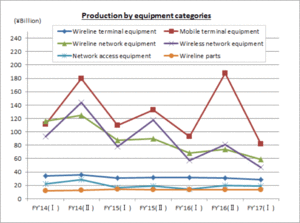
Wireline terminal equipment: 28.8 billion yen (11.2% year-over-year growth) of which:
Telephone sets accounted for 1.7 billion yen (-4.3% year-over-year growth), key telephones was 11.5 billion yen (-18.4% year-over-year growth), intercom was 15.0 billion yen (-1.2% year-over-year growth) and facsimile equipment was 600 million yen (-3.5% year-over-year growth). The round of replacement for key telephones ended in FY2016, resulting in the negative growth.
Mobile terminal equipment: 81.7 billion yen (-12.0% year-over-year growth) of which:
Mobile phones accounted for 59.6 billion yen (-8.1% year-over-year growth) and public-use PHS terminals was 700 million yen (+31.9% year-over-year growth). Domestic demand for smartphones remains positive, but domestic production continues to decline.
Wireline network equipment: 58.9 billion yen (-13.6% year-over-year growth) of which:
Switching systems accounted for 2.4 billion yen (-45.5% year-over-year growth), central office switching systems was 6.4 billion yen (-18.1% year-over-year growth), digital transmission equipment was 19.3 billion yen (-18.0% year-over-year growth) and other transmission equipment was 28.3 billion yen (-2.1% year-over-year growth). The central office switching system market is now solely parts replacement and maintenance. Construction of hotels and offices should lead to new demand for key telephones and PBXs, but the trend for smaller systems will push the unit investments down and not contribute to a recovery.
Wireless network equipment: 48.6 billion yen (-18.6% year-over-year growth) of which:
Fixed telecommunication equipment accounted for 15.5 billion yen (-4.3% year-over-year growth) and base stations: 31.3 billion yen (-24.2% year-over-year growth). Despite higher domestic demand for base stations to accommodate traffic growth, the penetration of imports pushed domestic production significantly lower.
- Network access equipment: 18.8 billion yen (+28.5% year-over-year growth). Robust demand for networks have kept growth positive since the latter half of FY2016.
- Wireline parts (relays for wireline equipment, connectors, etc.): 13.7 billion yen (+2.6% year-over-year growth). Demand for high-end parts for a major U.S. smartphone brand has kept growth in the positive since the second half of FY2016.
II. Exports
(based on Ministry of Finance’s “Trade Statistics”)
(1) Actual figures for first half of FY2017
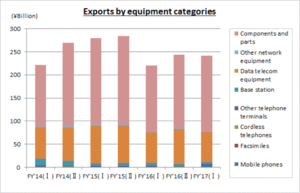
The total figure for exports in the first half of FY2017 was 242.1 billion yen (+9.9% year-over-year growth). Most categories had positive growth over the FY2016H1 figures, when the yen was much stronger. The export of mobile phones to the U.S. market showed significant growth. Demand for high-end parts for a major U.S. smartphone brand resulted in a positive turnaround for the first time in 2 years.
(2) Figures by equipment categories
Telephone sets and terminal equipment: 7.1 billion yen (+230.7% year-over-year growth) of which:
Mobile phones accounted for 5.8 billion yen (+723.6% year-over-year growth), facsimiles was 30 million yen (-69.4% year-over-year growth), cordless handsets for landline phones was 200 million yen (+83.6% year- over-year growth) and other was 1.1 billion yen (-10.0% year-over-year growth).
Network equipment: 71.9 billion yen (-4.5% year-over-year growth) of which:
Base stations accounted for 3.0 billion yen (-56.2% year-over-year growth), data communication equipment was 66.0 billion yen (-0.2% year-over-year growth) and other network equipment was 2.9 billion yen (+22.4% year-over-year growth).
- Parts: 163.0 billion yen (+14.2% year-over-year growth).
(3) Figures by region
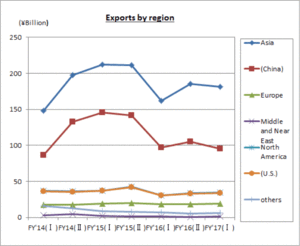
By region, Asia was 181.4 billion yen (+12.0% year-over-year growth), of which China was 95.3 billion yen (-2.0% year-over-year growth). North America was 34.3 billion yen (+11.1% over the same quarter of the previous year), of which the U.S. was 33.8 billion yen (+11.5% over the same quarter of the previous year). Europe was 19.1 billion yen (+1.8% over the same quarter of the previous year), of which the EU was 17.1 billion yen (+0.1% over the same quarter of the previous year). Exports of mobile phones to the U.S. sky-rocketed by 4,243%. The export of parts to China decreased to 50.7% of total exports, indicating adjustments in the production of smart phones in China and the shift in production to other Asian countries.
(4) Comparison and breakdown by regions
| First: | Asia 74.9% (+4.5% over the same quarter of the previous year) |
| Second: | North America 14.2% (-1.7% over the same quarter of the previous year) |
| Third: | Europe 7.9% (-2.1% over the same quarter of the previous year) |
| Other regions: | 3.0% (-0.7% over the same quarter of the previous year) |
III. Imports
(based on Ministry of Finance’s “Trade Statistics”)
(1) Actual figures for first half of FY2017
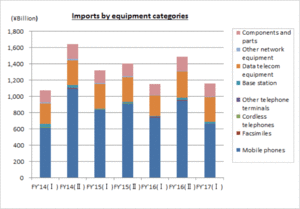
The total figure for imports was 1.160 trillion yen (+0.9% year-over-year growth), continuing positive growth from FY2016H2. Mobile phones, which makes up 57% of total imports, decreased by 11.9%, reflecting the small impact of a major U.S. smartphone brand. Though small in yen value, the domestic demand for base stations grew by 133.2%.
(2) Figures by equipment categories
Telephone sets and terminal equipment: 660.5 billion yen (-11.7% year-over-year growth) of which:
Mobile phones accounted for 651.9 billion yen (-11.9% year-over-year growth), facsimiles was 2.6 billion yen (+15.0% year-over-year growth), cordless handsets for landline phones was 2.6 billion yen (+10.8% year-over-year growth) and other was 3.4 billion yen (+5.9% year-over-year growth).
Network equipment: 336.5 billion yen (+25.8% year-over-year growth) of which:
Base stations accounted for 24.3 billion yen (+133.2% year-over-year growth), data communication equipment was 302.8 billion yen (+21.8% year-over-year growth) and other network equipment was 9.4 billion yen (+12.0% year-over-year growth).
- Parts (total of both wireline and wireless): 162.6 billion yen (+21.9% year-over-year growth).
(3) Figures by region
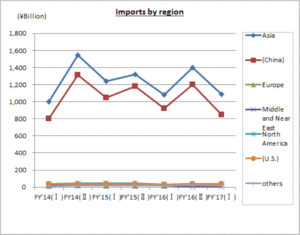
By region, Asia was 1.088 trillion yen (+0.5% year-over-year growth), of which China was 847.6 trillion yen (-8.2% year-over-year growth). North America was 38.2 billion yen (+12.7% over the same quarter of the previous year), of which the U.S. accounted for 37.4 billion yen (+14.6% over the same quarter of the previous year). Europe was 16.4 billion yen (+3.0% over the same quarter of the previous year), of which the EU was 15.8 billion yen (+1.6% over the same quarter of the previous year).
(4) Comparison and breakdown by regions
| First: | Asia 93.9% (-0.1% over the same quarter of the previous year) |
| Second: | North America 3.3% (+0.2% over the same quarter of the previous year) |
| TEuropehird: | Europe 1.4% (-0.1% over the same quarter of the previous year) |
| Other regions: | 1.5% (0.0% over the same quarter of the previous year) |
IV. Trends in Orders Received and Shipped
(from CIAJ statistics)
(1) FY2017H1 actual
CIAJ statistics for total orders received and shipped in FY2017H1 amounted to 842.3 billion yen (+3.6% over the same quarter of the previous year) for the quarter, of which the total value of domestic shipments totaled 647.3 billion yen (+2.1% over the same quarter of the previous year) and exports was 195 billion yen (+9.2% over the same quarter of the previous year).
(2) Figures by equipment categories
Wireline terminal equipment: 314.4 billion yen (+2.6% year-over-year growth):
Both personal and office use multi-functioning facsimiles showed healthy growth over the previous year.
Mobile terminal equipment: 295.5 billion yen (+21.5% year-over-year growth):
Mobile phones showed substantial year-over-year growth over FY2016 H1 which was impacted by the end to ¥0 (carrier subsidized) mobile phones.
Wireline network equipment: 71.5 billion yen (-13.1% year-over-year growth):
PON, media converters and WDM transmission equipment categories exceeded FY2016 H1 figures.
Wireless network equipment: 119.7 billion yen (-15.1% year-over-year growth):
The satellite communication equipment category indicated healthy growth, terrestrial communication equipment had slight growth, while base stations indicated a slight drop.
- Other network equipment: 19.5 billion yen (-0.5% year-over-year growth). Routers had negative growth, while LAN switches indicated year-over-year growth.
Parts: 21.7 billion yen (+6.1% year-over-year growth).
For details, contact
Market Research
CIAJ
tel: 81-3-5403-9356 fax: 81-3-5403-9360
For more general inquiries, contact
Corporate Communications
CIAJ
tel: 81-3-5403-9351 fax: 81-3-5403-9360
